- USD/CAD makes a U-turn this Tuesday as the market rejects the 1.3380 resistance.
- The levels to beat for bears are the 1.3311 and 1.3284 support levels.
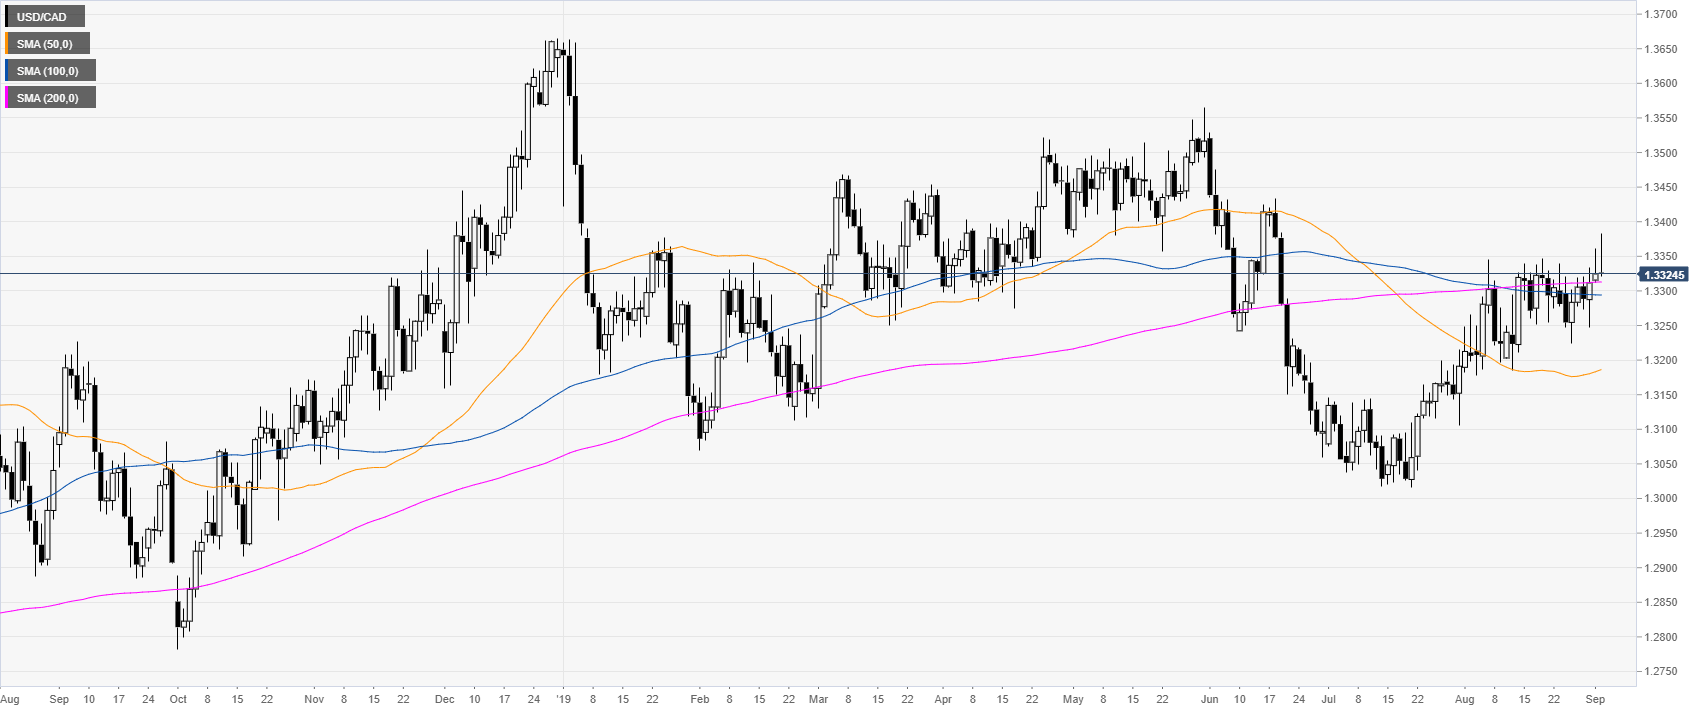
USD/CAD daily chart
USD/CAD is retreating after peaking at its highest since mid-June 2019. The market is evolving above the main simple moving averages (SMAs), suggesting bullish momentum.
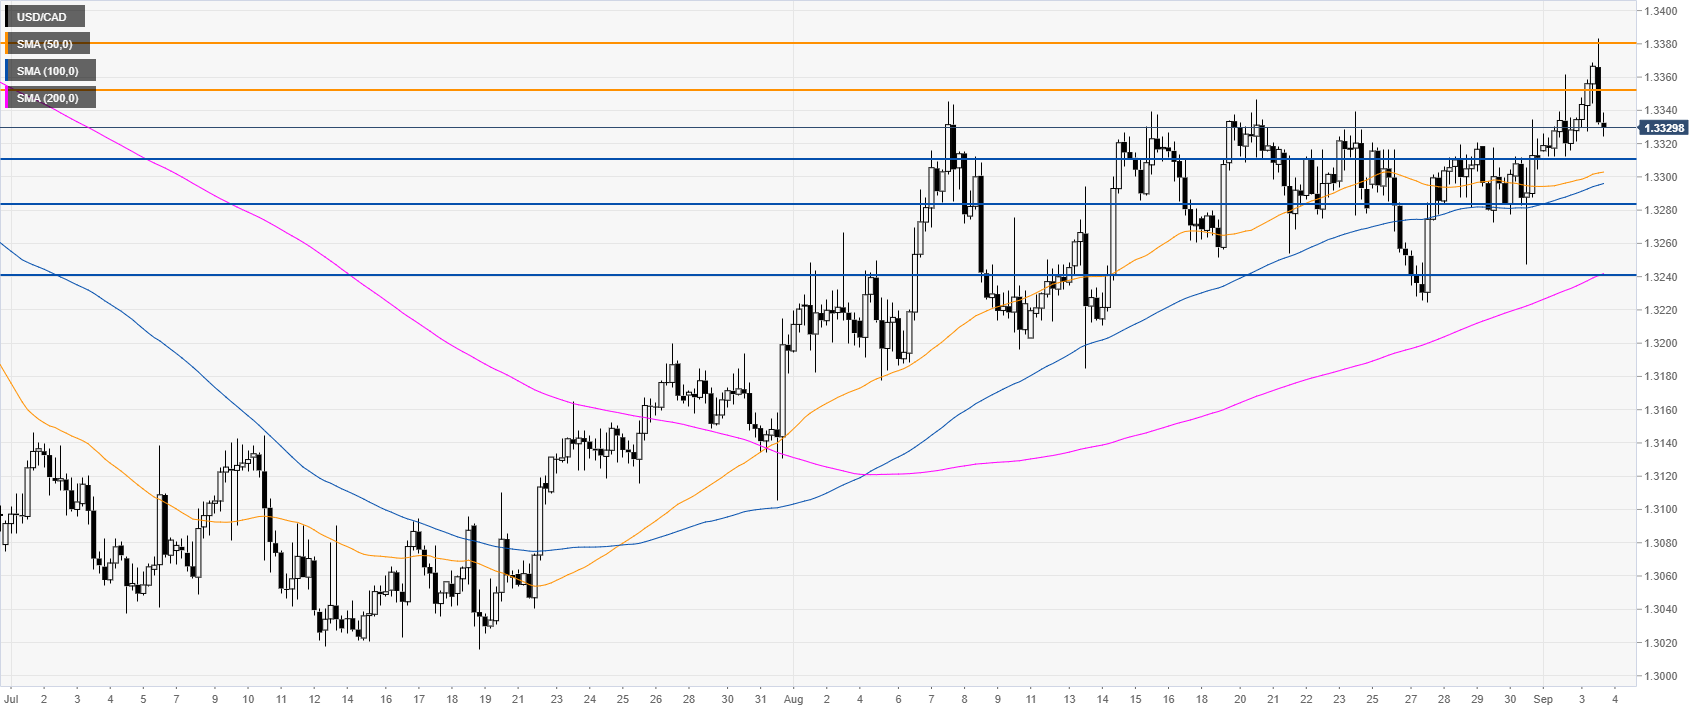
USD/CAD 4-hour chart
USD/CAD is trading above its main SMAs, suggesting bullish momentum in the medium term. However the market is losing considerable momentum and buyers will need to recapture the 1.3353 and 1.3380 resistances if they want to continue their ascent, according to the Technical Confluences Indicator.
USD/CAD 30-minute chart
USD/CAD is reversing the intraday gains as the market is below the 100 and 200 SMAs; all-in-all suggesting sideways to downward momentum in the near term. If the sellers gather strength, they can drive the market towards the 1.3311, 1.3284 and 1.3242 levels, according to the Technical Confluences Indicator.

Additional key levels
