- Failure to break 4H 200MA, 50% Fibonacci retracement pulls the EUR/JPY pair downwards.
- A five-week-old descending trend-line adds to the resistance.
- RSI reversing from overbought conditions.
Having failed to cross near-term key resistances, EUR/JPY drops to 117.85 during Monday morning in Asia.
With the 14-bar relative strength index (RSI) declining further from overbought conditions, prices are likely stepping down to 100-bar simple moving average on the four-hour chart (4H 100MA), at 117.54 now.
However, 23.6% Fibonacci retracement of a July-September downpour near 117.15 and August 25 bottom surrounding 116.60 could restrict the pair’s further declines.
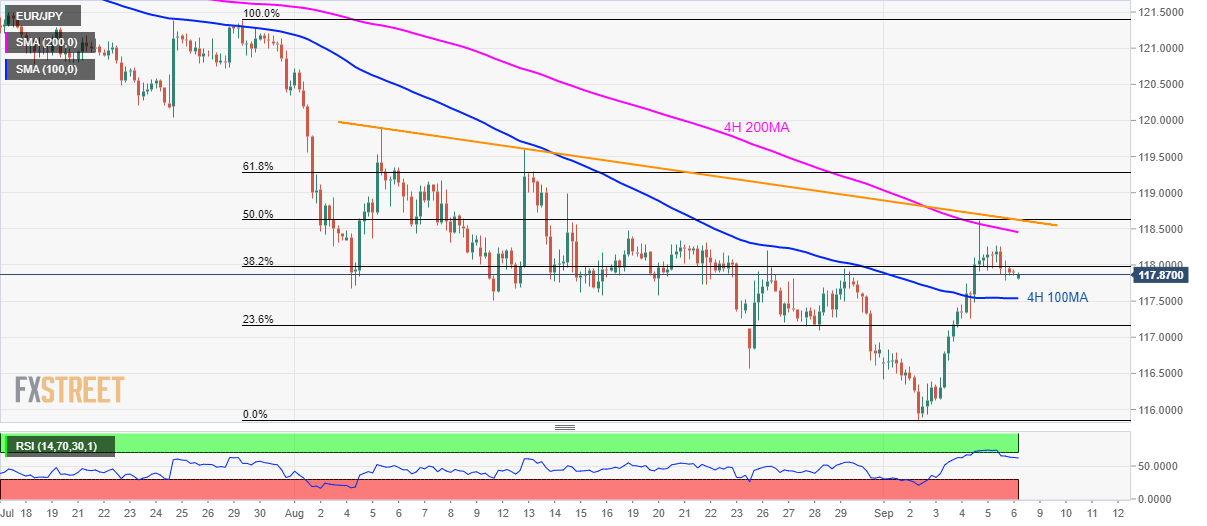
On the upside, 118.30 can act as an immediate resistance ahead of 200-bar moving average (4H 200MA) level of 118.45 and 118.62/65 confluence area including a five-week-old falling trend-line and 50% Fibonacci retracement.
In a case where prices rally beyond 118.65, 61.8% Fibonacci retracement level of 119.28 and August 13 top close to 119.60 could be on buyers’ radar.
EUR/JPY 4-hour chart
Trend: pullback expected
