- The Aussie is breaking above last week’s highs.
- The level to beat for bulls is the 0.6894 resistance.
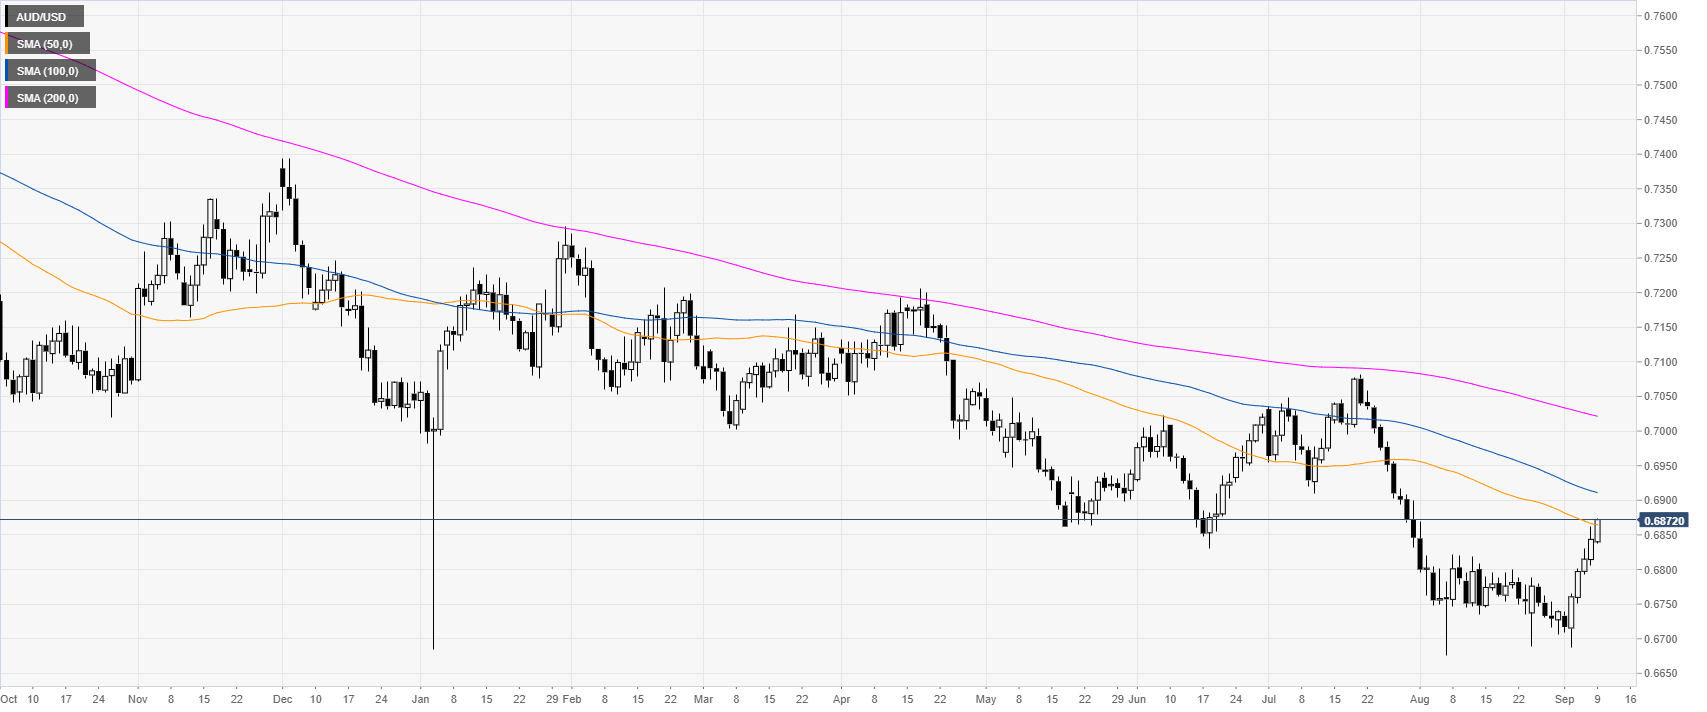
AUD/USD daily chart
The Aussie is trading in a bear trend below the 100 and 200-day simple moving averages (SMAs). However, the bulls have been advancing strongly last week and are challenging the 50 SMA.
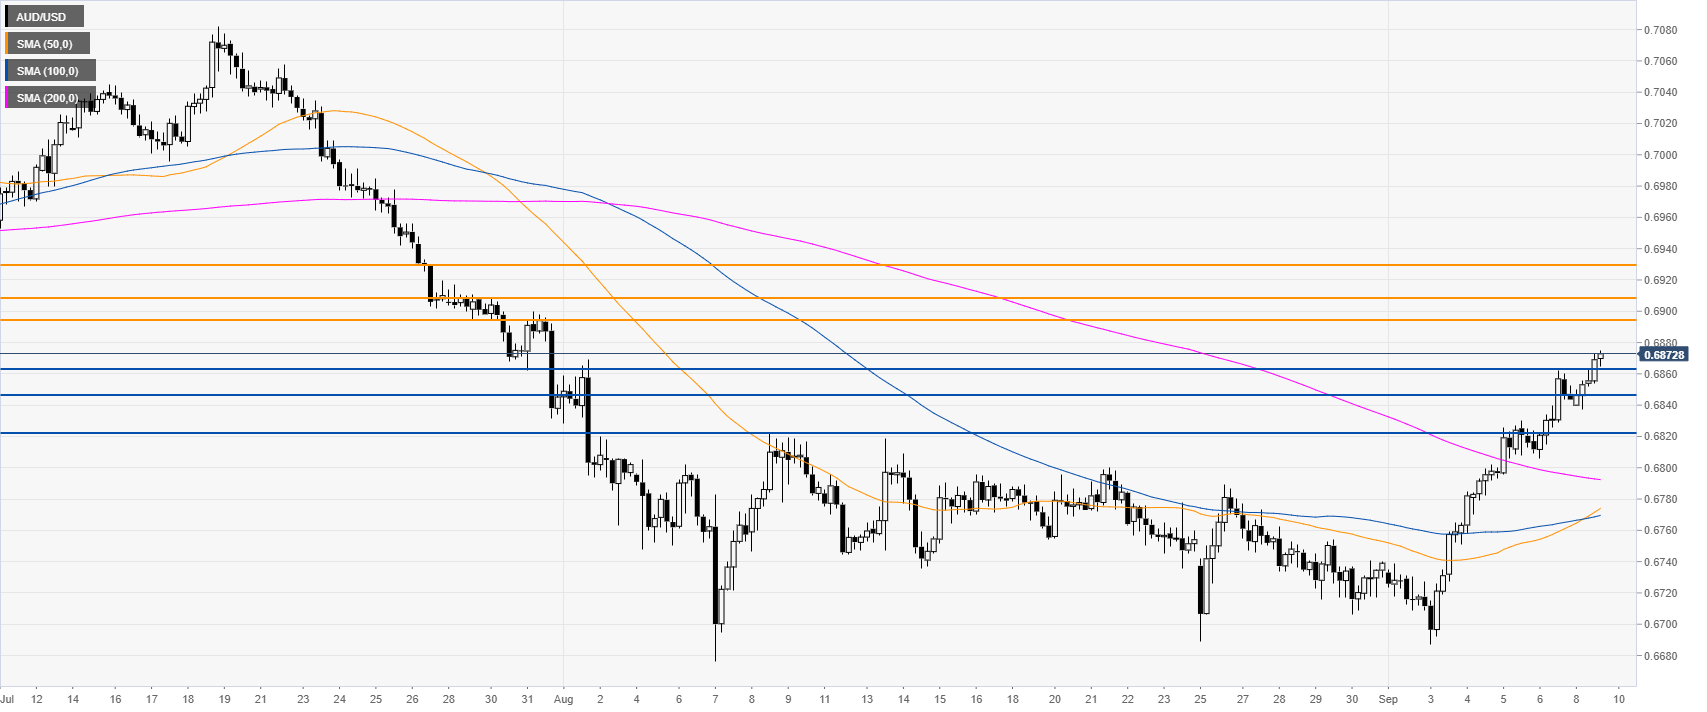
AUD/USD 4-hour chart
The Aussie is trading above its main simple moving averages (SMAs) suggesting bullish momentum in the near term. The buyers want to extend the uptrend towards 0.6894, 0.6908 and 0.6930, according to the Technical Confluences Indicator.
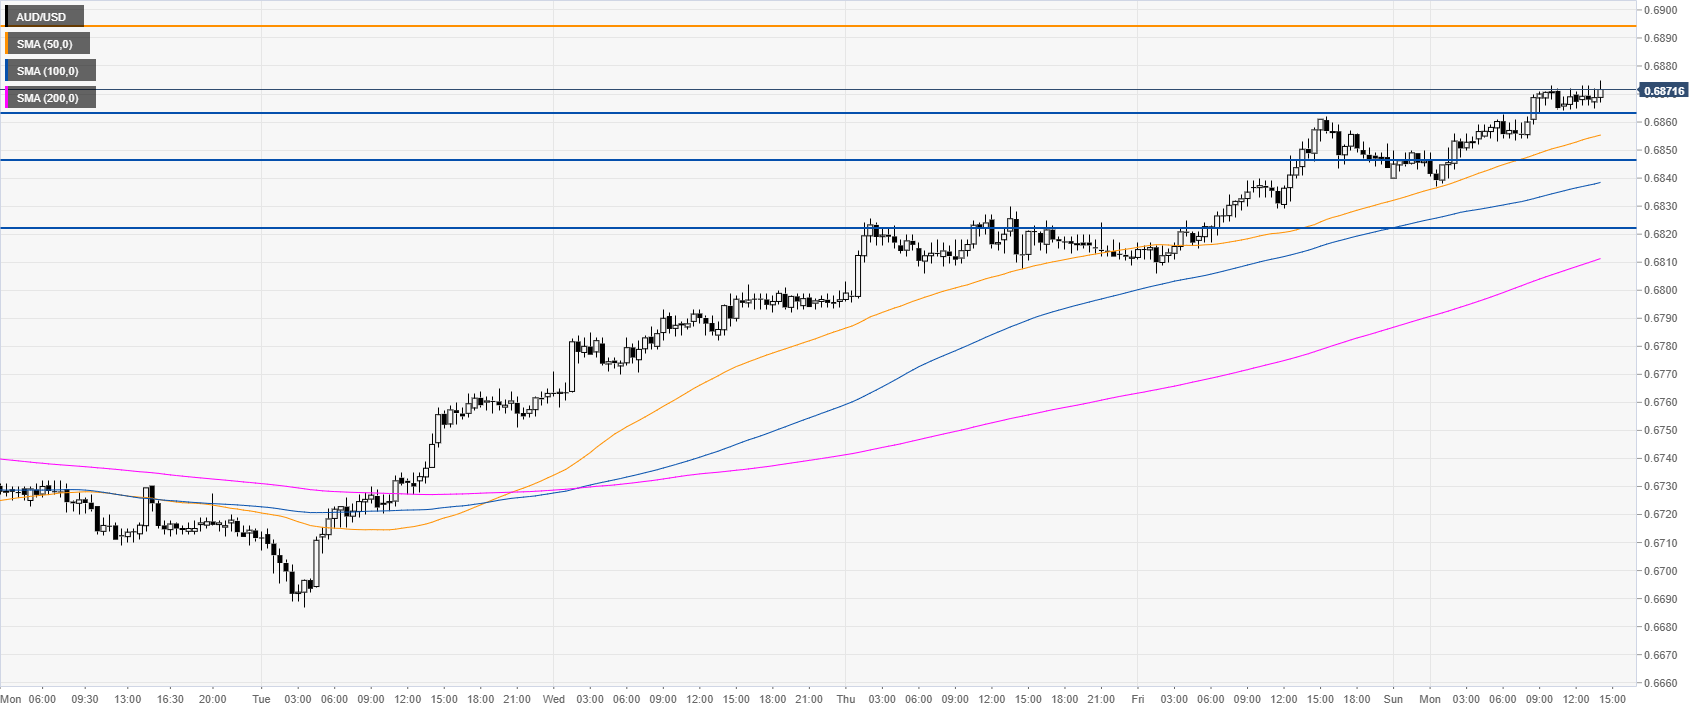
AUD/USD 30-minute chart
The market is under bullish pressure as AUD/USD is trading above its main SMAs on the 30-minute time-frame. Immediate supports can be seen at 0.6865, 0.6844 and 0.6822, according to the Technical Confluences Indicator.
Additional key levels
