- Despite repeated failures to cross 50% Fibonacci retracement level, GBP/USD stays above 50-day EMA.
- Bullish MACD raises the case for pair’s advances to 1.2470/72 resistance-confluence after the breakout.
GBP/USD clings to 1.2330 while heading into Thursday’s UK session open.
The pair seems to be chopped between the 50-day exponential moving average (EMA) level of 1.2313 and 50% Fibonacci retracement of June to September month declines, at 1.2372.
It should, however, be noted that 12-day moving average convergence and divergence (MACD) indicator remains bullish and hence buyers will look for entry beyond 1.2372 while targeting July 23 low of 1.2418.
However, 100-day EMA and 61.8% Fibonacci retracement around 1.2470/72 could question bulls past-1.2418, if not then 1.2500 will become their favorites.
Alternatively, pair’s declines below 1.2313 can take aim for early-August tops surrounding 1.2210 whereas 23.6% Fibonacci retracement level of 1.2152 might restrict additional weakness.
GBP/USD daily chart
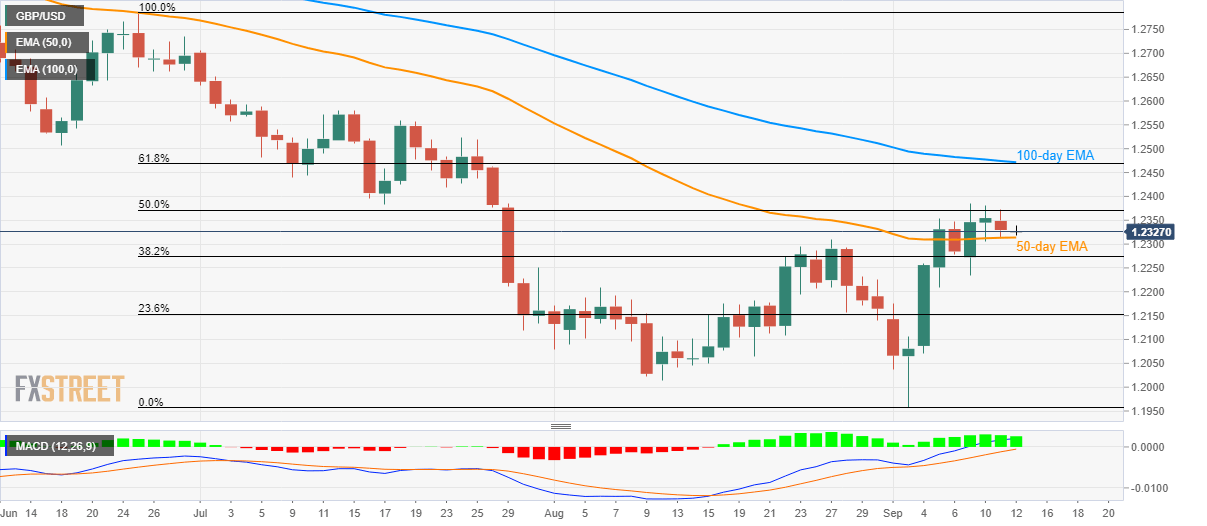
Trend: sideways
