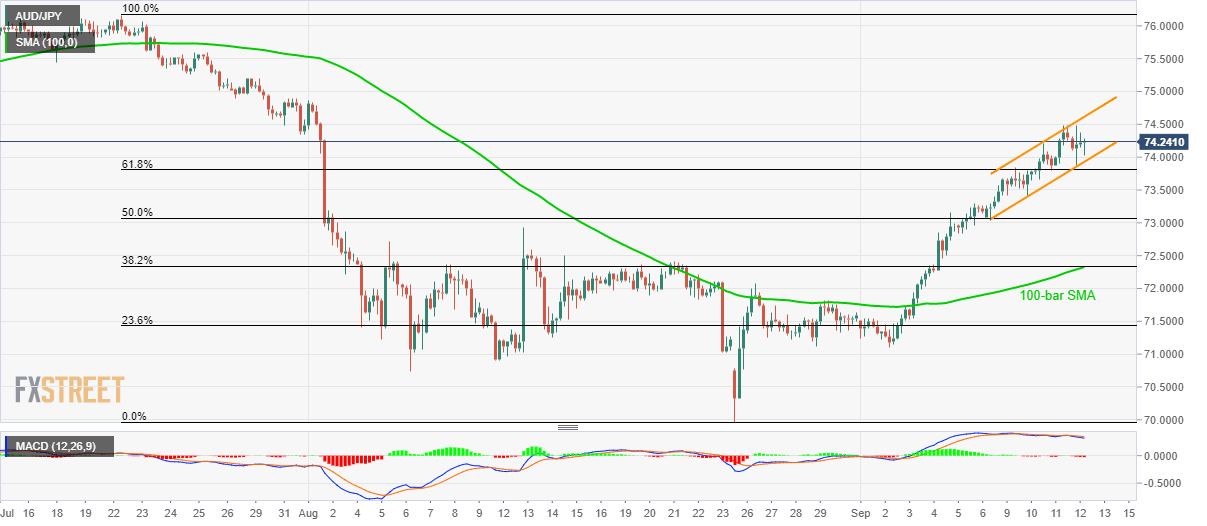
- AUD/JPY follows the four-day-old rising channel, MACD sends a bearish signal.
- Key Fibonacci retracement levels and 100-bar SMA could challenge sellers if the channel formation breaks to the downside.
- 74.90 caps the immediate upside.
Even after following a four-day long rising channel, AUD/JPY seems to lose its allure as the 12-bar moving average convergence and divergence (MACD) indicator flashes a bearish signal while the prices seesaw around 74.25 during early Asian session on Friday.
With this, sellers will wait for the downside break of channel support, at 73.92 now, before stepping in. However, 61.8% Fibonacci retracement level of late-July to August declines, at 73.80 and 73.07 level comprising 50% Fibonacci retracement could question bears afterward.
In a case where the quote remains weak after 73.07, a confluence of 38.2% Fibonacci retracement and 100-bar simple moving average (SMA) near 72.33/30 could flash on the traders’ radar.
On the contrary, the channel’s upper-line near 74.60 and multiple highs marked during July-end near 74.90 could keep the buyers in check.
Should bulls dominate beyond 74.90, 75.25 and July 22 high near 76.15 will become their favorites.
AUD/JPY 4-hour chart
Trend: pullback expected
