- NZD/USD bounces off one-week low while following near-term trading range.
- 200-HMA adds to the support before highlighting 50% Fibonacci retracement level.
Following its drop to the lowest in a week, NZD/USD bounces back above 0.6400 level while following immediate trading range on early Friday.
The pair can now confront 23.6% Fibonacci retracement of its rise since September 03, at 0.6410. However, 0.6430 and the range resistance around 0.6445 could question further upside.
In a case prices rally beyond 0.6445, 50-day exponential moving average (EMA) around 0.6470 and May month lows near 0.6485 may please buyers.
On the downside break of 0.6395 support, 200-hour simple moving average (SMA), at 0.6390, becomes the key as declines below the same can drag the pair to 50% Fibonacci retracement level of 0.6360.
NZD/USD hourly chart
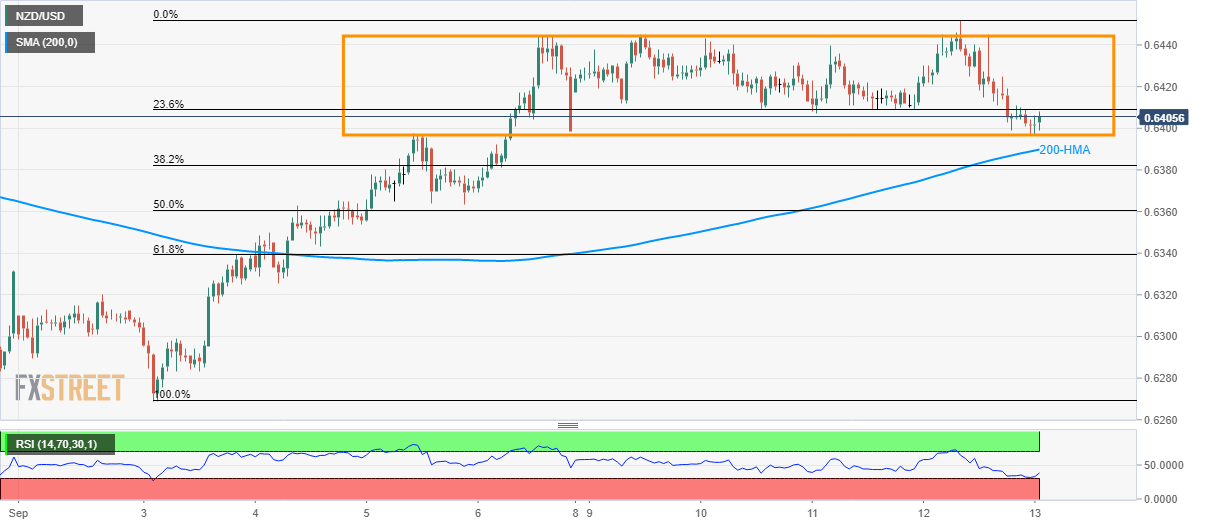
Trend: sideways
