- GBP/USD aims to revisit short-term rising trend-line.
- Bearish MACD pushes sellers to wait for entry below immediate support-line.
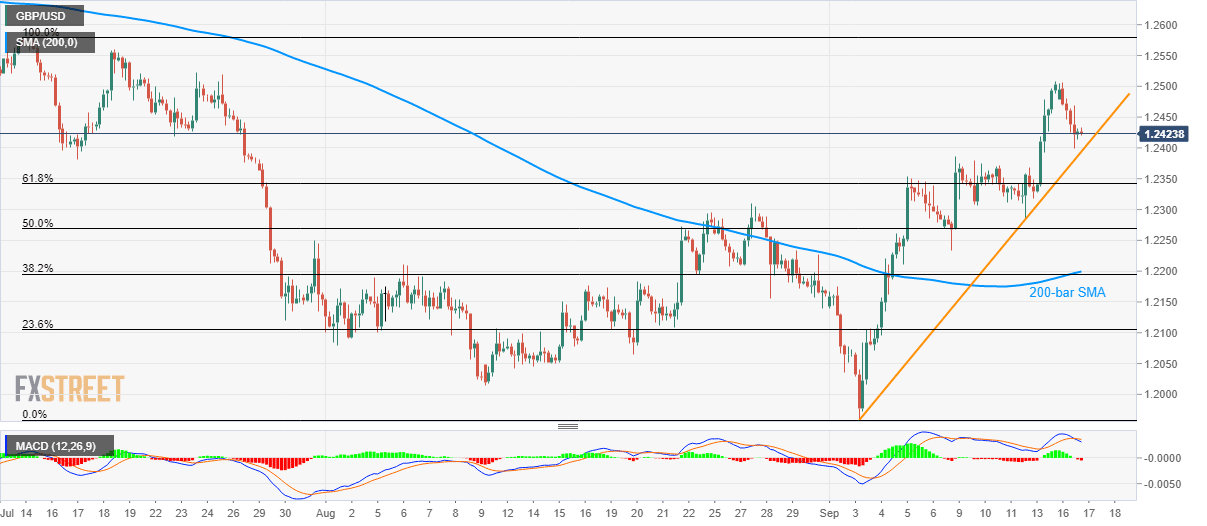
Following its pullback from 1.2507, GBP/USD has been on the sellers’ radar with the recent quotes being around 1.2430 amid initial Tuesday morning in Asia.
Even so, sellers are waiting for the successful break below of an upward sloping trend-line since September 03, at 1.2394, in order to target September 09 high around 1.2385 and 61.8% Fibonacci retracement level of July-September declines, near 1.2340.
Supporting the sellers is a bearish signal from 12-bar moving average convergence and divergence (MACD) indicator.
It should, however, be noted that pair’s declines below late-August high near 1.2310, also beneath the September 09 low of 1.2234, opens the gate for pessimists’ visit to 1.2195-1.2200 support confluence visit including 200-bar simple moving average and 38.2% Fibonacci retracement.
On the contrary, pair’s run-up beyond 1.2500 has multiple barriers in the form of late-July highs surrounding 1.2520 and 1.2560 that hold the key for July month top of 1.2580.
GBP/USD 4-hour chart
Trend: pullback expected
