- USD/IDR takes the bids to seven-day high after breaking six-week-old trend-line.
- The pair needs to clear 100-day EMA to aim for 50% Fibonacci Retracement, 200-day EMA.
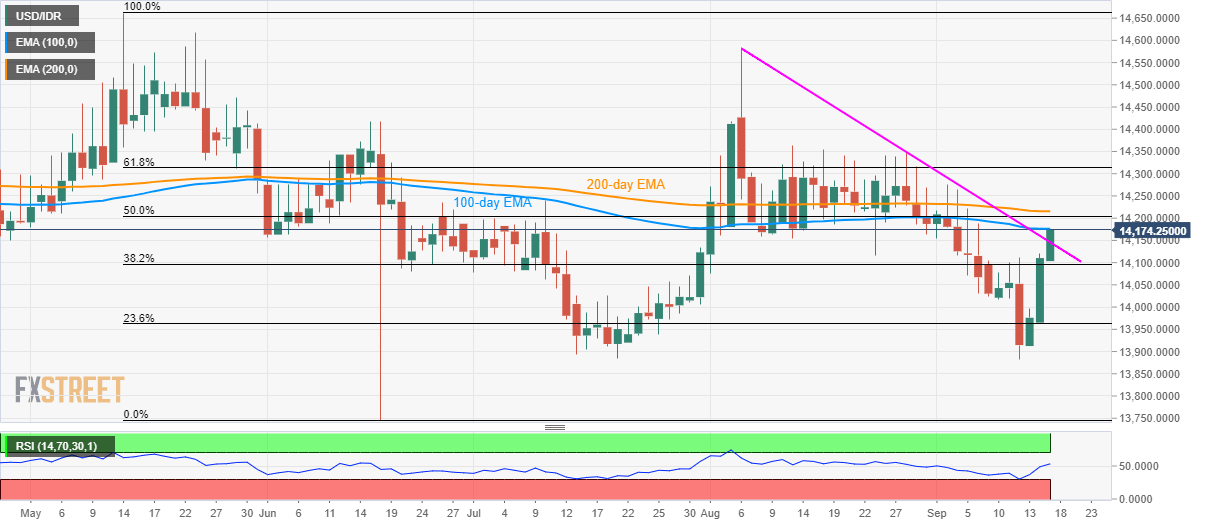
Despite breaking six-week-old falling trend-line, USD/IDR trades below key resistances as it takes the rounds to 14,175 on early Tuesday.
The quote presently confronts 100-day exponential moving average (EMA) near 14,180, a sustained break of which could escalate the run-up towards 50% Fibonacci retracement of May-June declines, at 14,205, followed by 200-day EMA level of 14,215.
Should prices manage to rise past-14,215, 61.8% Fibonacci retracement level of 14,313 and multiple highs surrounding 14,350/60 will be on buyers’ radar.
Meanwhile, a downside break below resistance-turned-support, at 14,145 will trigger fresh pullback towards 38.2% Fibonacci retracement of 14,100 and then to 14,000 round-figure.
During the pair’s south-run past14,000, monthly bottom near 13,880 and June month downtick close to 13,750 become the key to watch.
USD/IDR daily chart
Trend: pullback expected
