- WTI stays firm above 11-month-old resistance-turned-support.
- 200-day EMA adds support to the downside.
With its sustained trading beyond 11-month-old falling trend-line, WTI takes the bids to $61.80 while heading into the European session on Tuesday.
As a result, 61.8% Fibonacci retracement of October-December 2018 declines, at $63.71, remains on the bulls’ radar while also dreaming to print a fresh yearly low above April tops surrounding $66.60.
Alternatively, July month high near $61.00 may entertain short-term sellers ahead of pushing them to confront the aforementioned resistance-turned-support-line, at $59.00.
However, the black gold’s strength can’t be denied unless it closes below 200-day exponential moving average (EMA) level of $57.90, which in turn opens the door for fresh declines to $55.60 including 38.2% Fibonacci retracement.
WTI daily chart
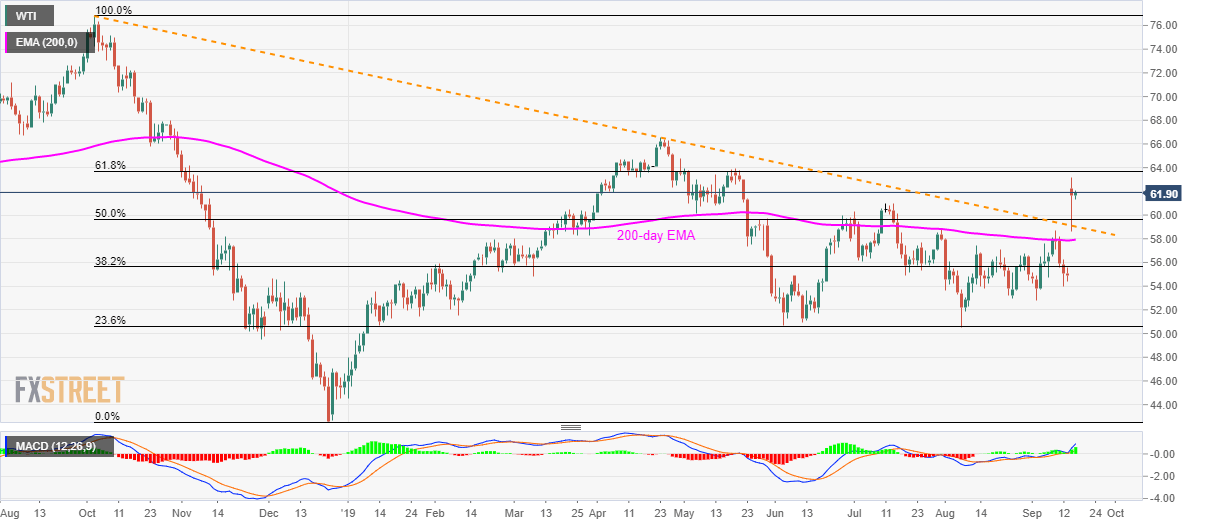
Trend: bullish
