- EUR/USD is consolidating Monday’s losses below the 1.1033 resistance.
- The level to beat for sellers is the 1.1000 level.
- The market is likely awaiting the FOMC on Wednesday.
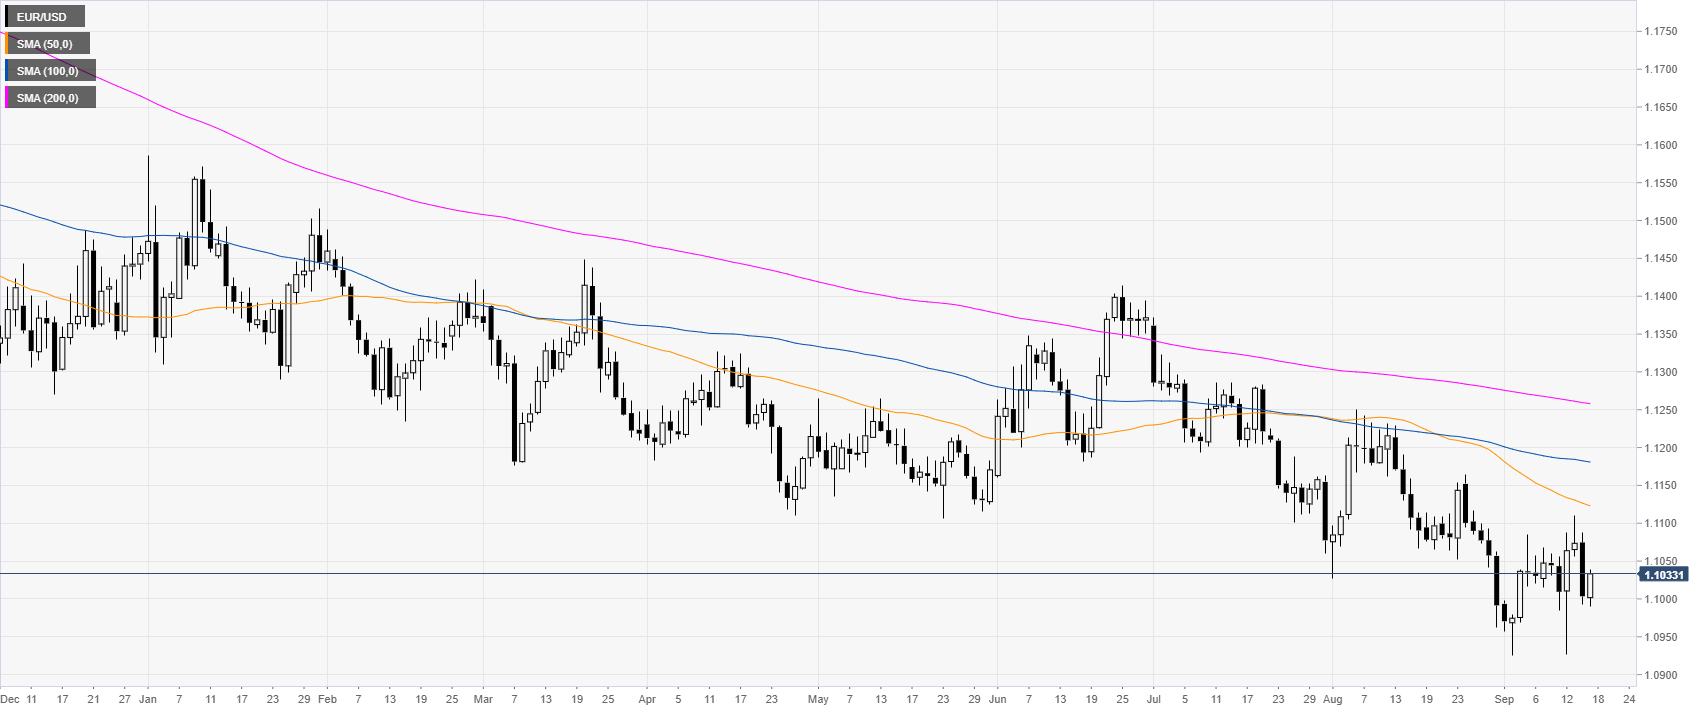
EUR/USD daily chart
The shared currency, on the daily chart, is trading in a bear trend below the main daily simple moving averages (DSMAs). This Tuesday, the German ZEW survey in Germany came in mixed while on Wednesday, investors will be watching the FOMC closely.
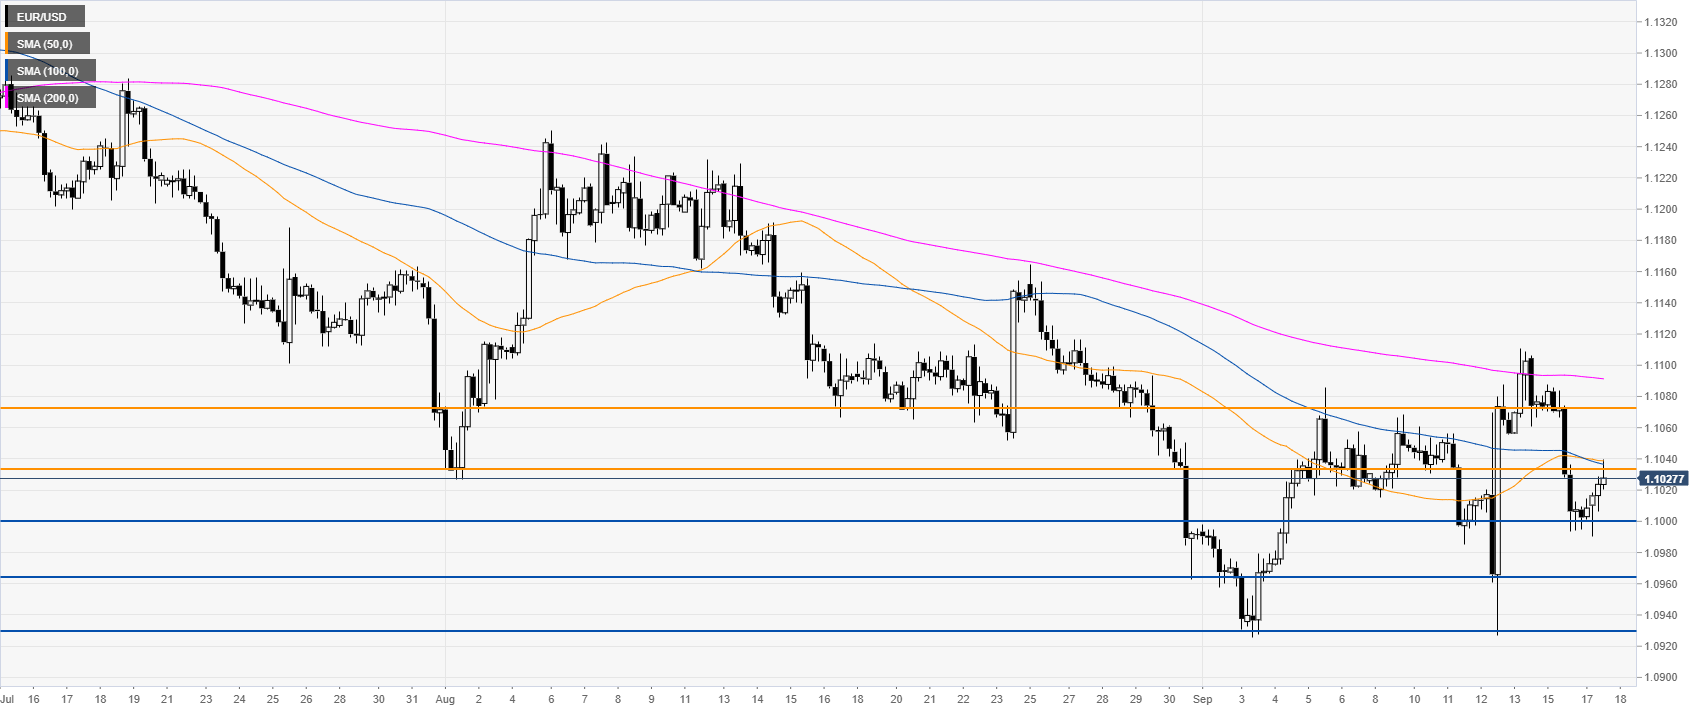
EUR/USD four-hour chart
The Fiber is challenging the 1.1033 resistance and the 50/100 SMAs. The medium term picture remains bearish. However, a daily close above this level could trigger a reaction up towards 1.1072, according to the Technical Confluences Indicator.
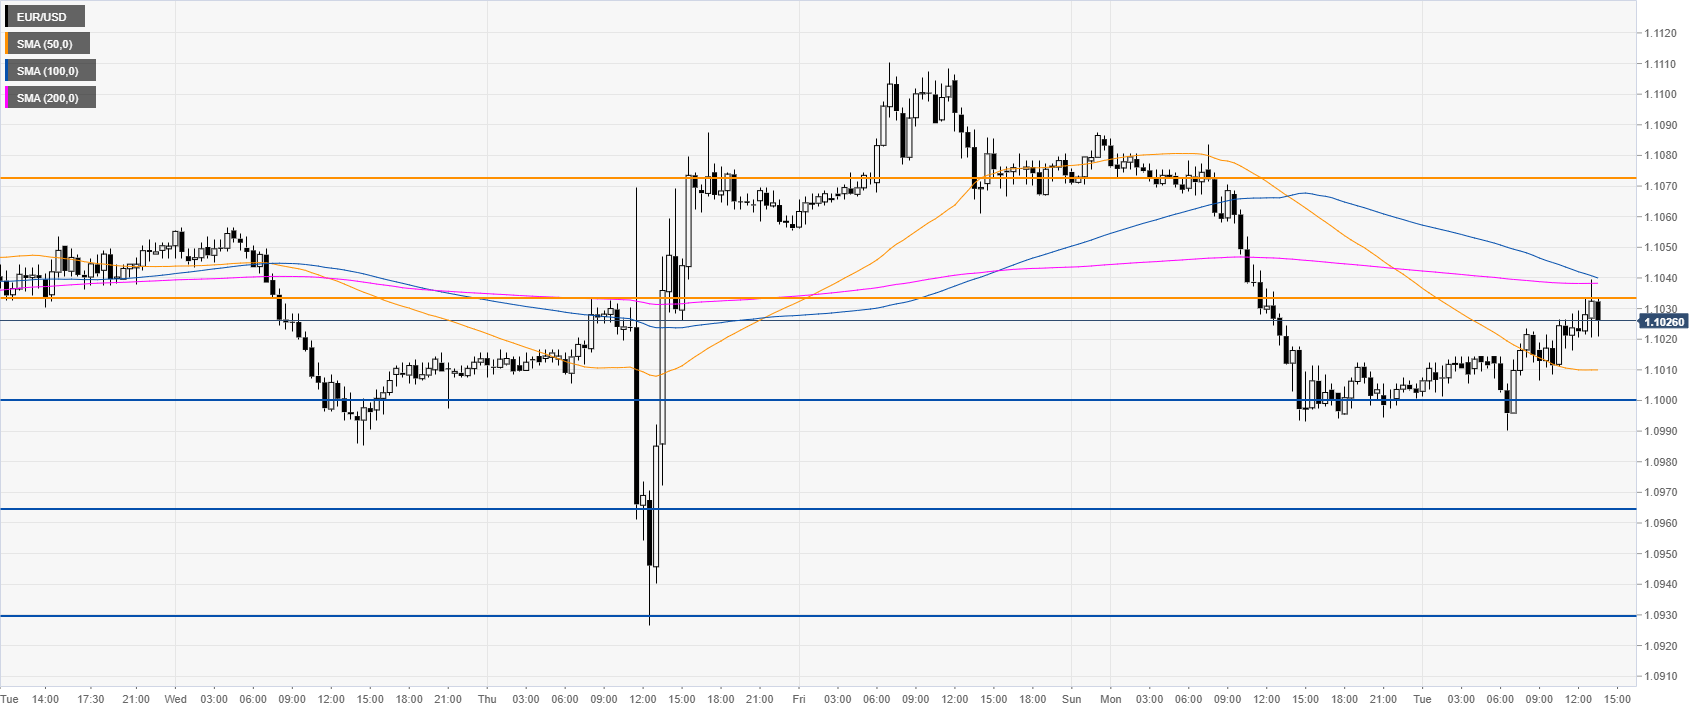
EUR/USD 30-minute chart
EUR/USD is consolidating Monday’s losses below the 100/200 SMAs. The level to beat for bears is the 1.1000 handle followed by 1.0964 and 1.0930 support levels.
Additional key levels
