- USD/IDR struggles between near-term support-line and key moving average (MA).
- Bullish MACD favors buyers targeting 50% Fibonacci retracement.
Chopped between the four-day-old rising trend-line and 200-hour moving average on the four-hour chart (4H 200MA), USD/IDR trades near 14,130 during early Wednesday.
With the bullish signal from 12-bar moving average convergence and divergence (MACD), buyers can look for 50% Fibonacci retracement level of August-September declines, at 14,233, as a target beyond 4H 200MA level of 14,188.
Though, 61.8% Fibonacci retracement of 14,315 and 14,350/60 area will challenge bulls past-14,233, if not then 14,440 and August month top surrounding 14,580 could flash on their radar.
On the downside, a break below 14,060 support-line can take rest near 14,000 round-figure to pave the way for further south-run in the direction to monthly bottoms close to 13,880.
USD/IDR 4-hour chart
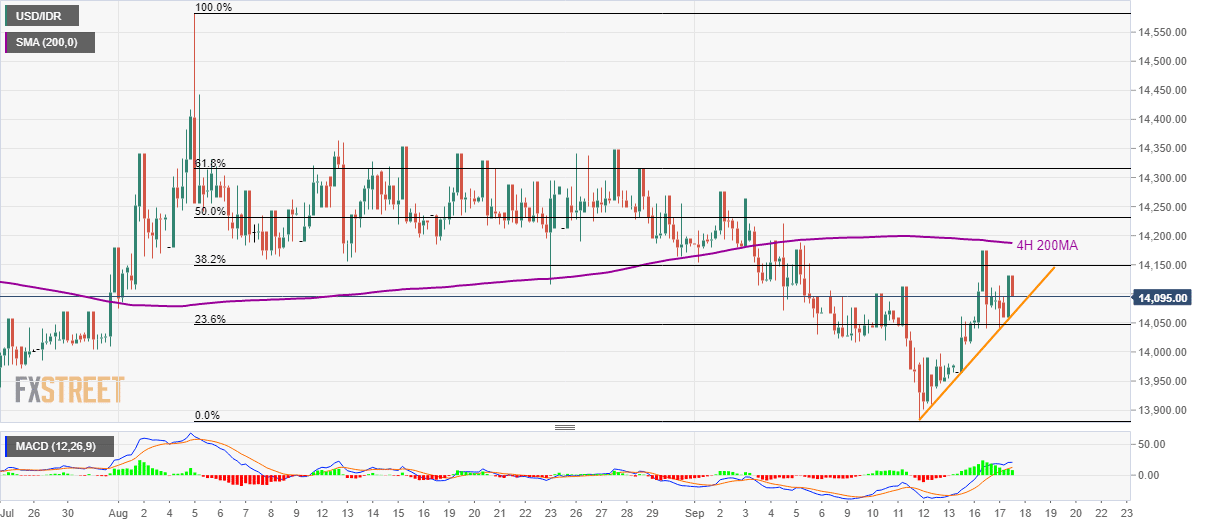
Trend: sideways
