- USD/CAD remains above 100-HMA, 38.2% Fibonacci retracement confluence.
- 61.8% Fibonacci retracement limits near-term advances.
With its refrain from declining below 100-hour simple moving average (HMA) and 38.2% Fibonacci retracement level of an early-month downside, USD/CAD takes the bids to 1.3250 during initial Asian session on Wednesday.
Given the normal conditions of 14-bar relative strength index (RSI) and pair’s sustained trading beyond key support confluence, prices are likely to again confront 61.8% Fibonacci retracement level of 1.3288 with 50% Fibonacci retracement around 1.3260 likely being an immediate resistance to watch.
In a case where the quote successfully emerges out of 1.3290, 1.3300 round-figure and 1.3315 can question buyers targeting monthly top close to 1.3385.
Alternatively, pair’s declines below 1.3235/30 support confluence can quickly fetch it to weekly bottom near 1.3210 with 23.6% Fibonacci retracement around 1.3193, followed by 1.3133, be the expected supports to observe during further south-run.
USD/CAD hourly chart
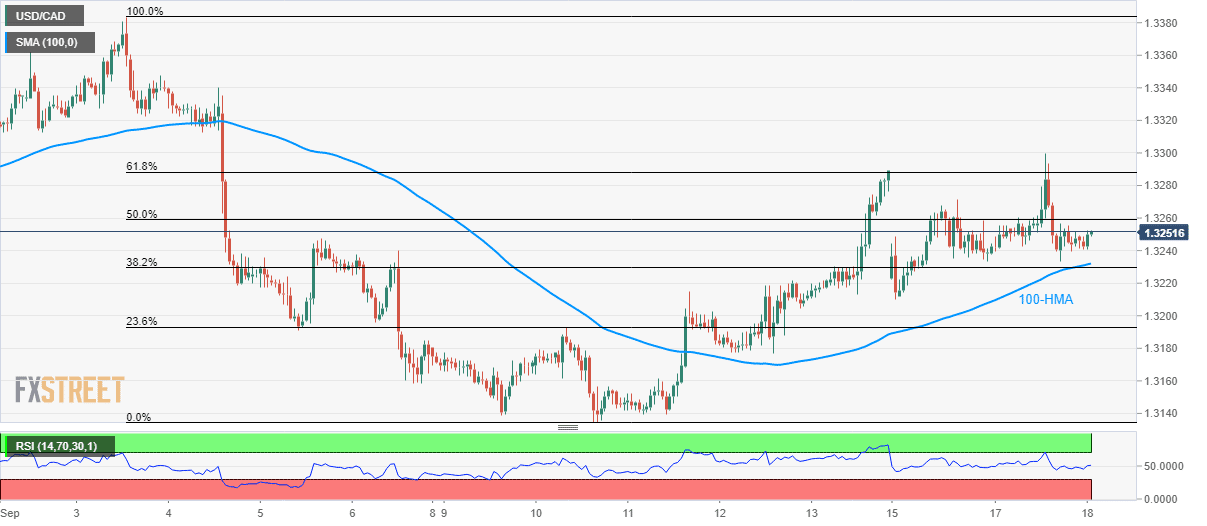
Trend: bullish
