- USD/IDR nears a week-long range’s support.
- 4H 200MA limits immediate upside.
- RSI portrays normal condition, indicating the range-trading to continue.
USD/IDR revisits one-week-old range support as it trades near 14,055 during the early Asian session on Monday.
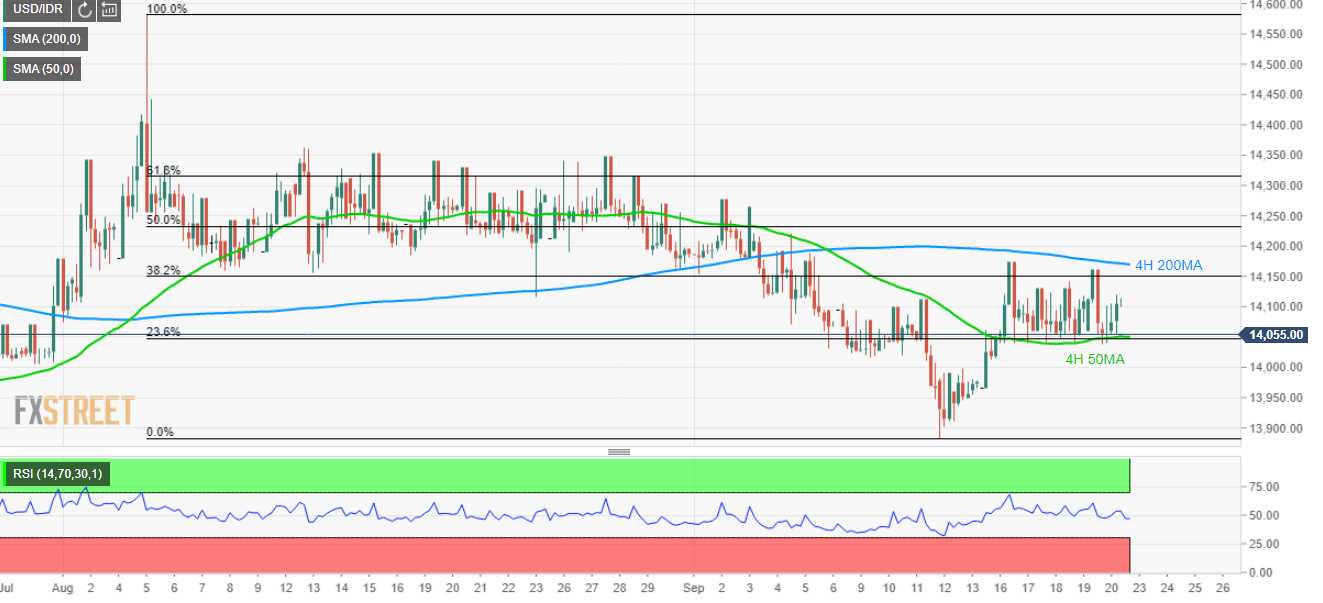
50-bar moving average on the four-hour chart (4H 50MA) and 23.6% Fibonacci retracement level of August-September declines has been restricting the pair’s downside since September 16, which together with normal condition of 14-bar relative strength index (RSI) indicate brighter chances of a pullback towards 38.2% Fibonacci retracement level of 14,150.
However, 200-bar moving average on the four-hour chart (4H 200MA), around 14,170 now, could restrict pair’s further recovery, if not then 50% and 61.8% Fibonacci retracement levels, near 14,232 and 14,315 respectively, could offer intermediate halts to the quote’s rally to late-August high around 14,340/50.
On the downside, pair’s declines below 14,050/48 support-confluence could please sellers with 13,990 and recent low close to 13,880.
USD/IDR 4-hour chart
Trend: sideways
