- USD/INR portrays a short-term descending trend-channel formation.
- Prices recently slipped below 4H 200MA towards the channel’s support.
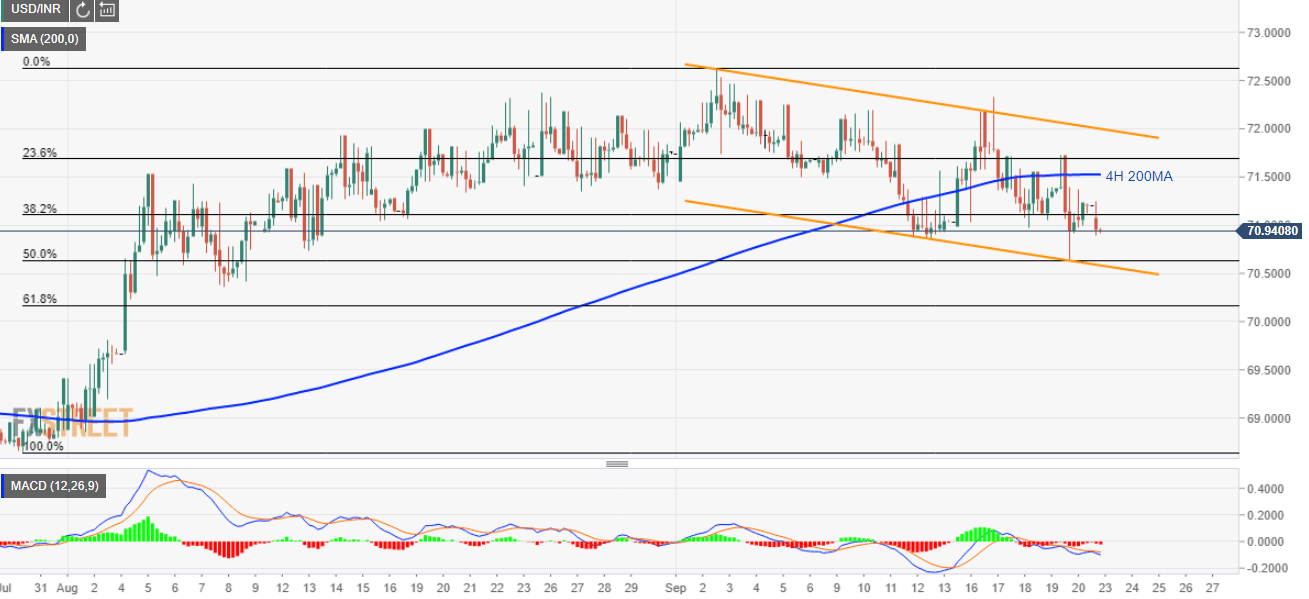
The USD/INR pair’s U-turn from 580% Fibonacci retracement of July-September upside fails to provide a decisive break above 4H 200MA, which in-turn drags the quote downwards to 70.95 by the press time that awaits the European market open on Monday.
While 50 % Fibonacci retracement and a three-week-old channel’s support could keep the pair’s declines limited around 70.64/58, 61.8% Fibonacci retracement level around 70.15 holds the key to additional south-run.
In doing so, 69.50, 69.00 and July month bottom close to 68.60 could be on sellers’ radars.
On the contrary, pair’s run-up beyond 200-bar moving average on the four-hour chart (4H 200MA), at 71.52, could question channel’s upper-line nearing 72.00.
In a case, prices keep rising past-72.00, monthly top around 72.65 and 73.00 can flash on the chart.
USD/INR 4-hour chart
Trend: pullback expected
