- GBP/USD stays below 50% Fibonacci retracement of May-September downpour.
- 200-day EMA offers additional upside barriers while 1.2385/80 limits near-term downside.
With another pullback from 50% Fibonacci retracement, GBP/USD drops to 1.2470 ahead of the UK open on Monday.
The pair now aims to revisit 38.2% Fibonacci retracement level of 1.2425. Though, 1.2385/80 horizontal-line comprising July 17 low and September 09 high could restrict further declines.
Should there be additional downside below 1.2380, August month high near 1.2310 and 23.6% Fibonacci retracement level near 1 .2250 could please bears.
Meanwhile, 50% Fibonacci retracement level of 1.2570 can act as an immediate resistance, a break of which could escalate the recovery towards 200-day exponential moving average (EMA) around 1.2660 now.
It should, however, be noted that pair’s successful run-up beyond 1.2660 enables buyers to target June month high nearing 1.2785, adjacent to late-May top close to 1.2815.
GBP/USD daily chart
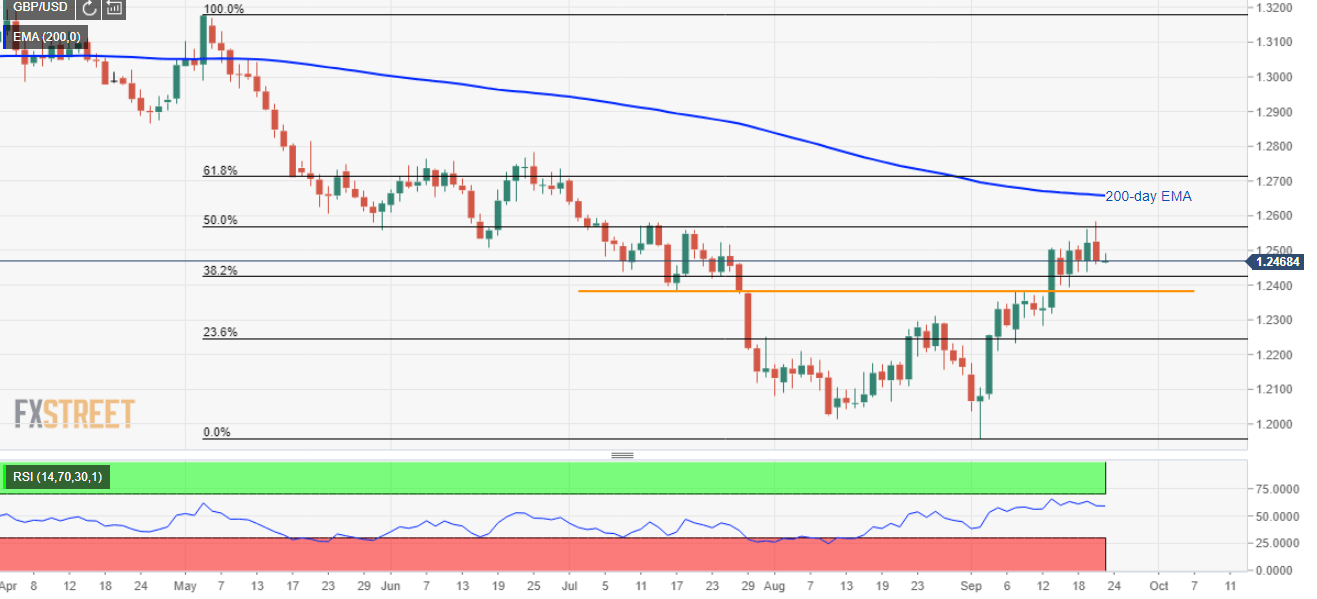
Trend: sideways
