- USD/IDR stays below 100-day EMA.
- The high of Friday’s Doji candle adds strength to the resistance.
- Recently long upper shadows portray bears’ dominance.
Despite flashing a Doji candle on Friday, followed by Monday’s inverted hammer-like formation, the USD/IDR pair stays on the back foot below 100-day EMA while taking rounds to 14,070 amid Tuesday’s Asian session.
The pair has been trading below 100-day exponential moving average (EMA) ever since the early-month days while recent long upper shadows of daily candles also signal the pair’s weakness.
As a result, a gradual downtick to 14,000 and 23.6% Fibonacci retracement of April-June declines, near 13,975, can’t be denied. However, the monthly bottom close to 13,880 seems a tough nut to crack for sellers during further declines.
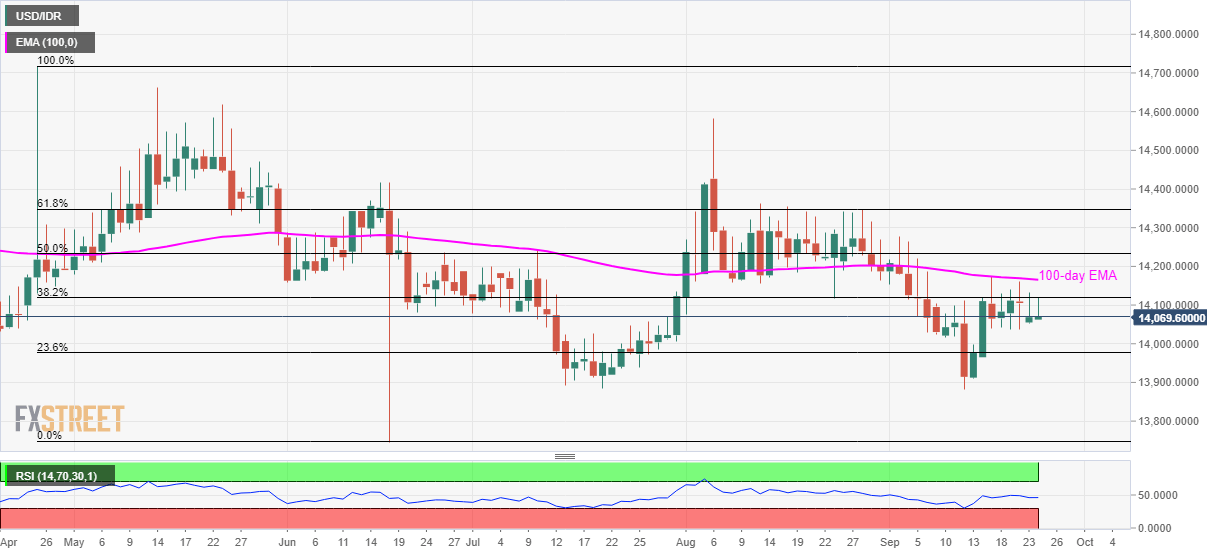
Meanwhile, 38.2% Fibonacci retracement level of 14,120 can please short-term buyers before challenging them with 14,062/65 area including 100-day EMA and top of Doji.
Should prices rally beyond 14,065 on a daily closing basis, 50% and 61.8% Fibonacci retracements around 14,230 and 14,350 will flash on buyers’ radar.
USD/IDR daily chart
Trend: bearish
