- EUR/USD is accelerating towards the 2019 lows.
- The level to beat for bears is the 1.0940 support level.
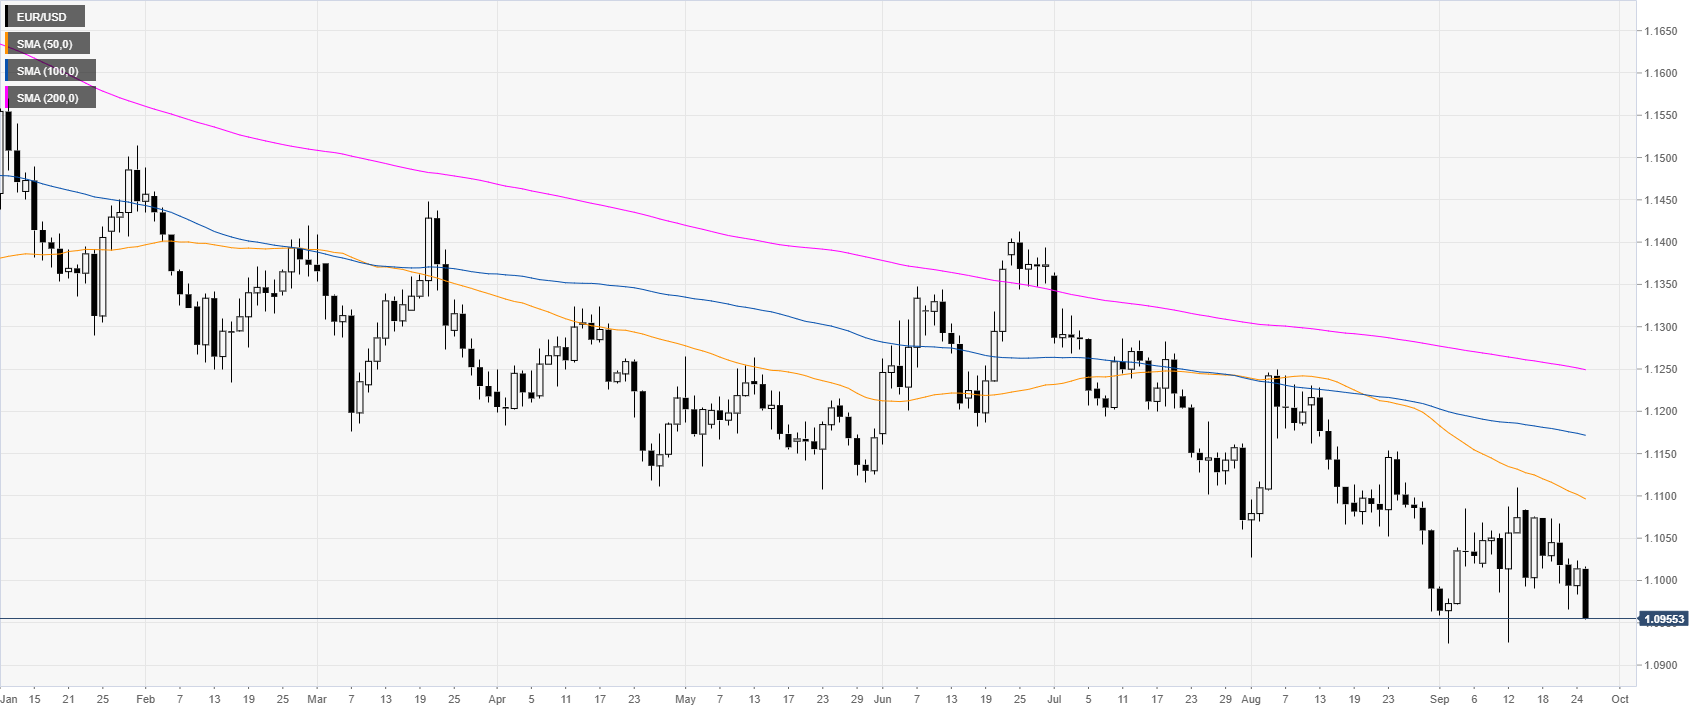
EUR/USD daily chart
The common currency, on the daily chart, is trading in a bear trend below the main daily simple moving averages (DSMAs). The market has been in a tight range in September.
EUR/USD four-hour chart
EUR/USD broke below the 1.0966 support. The market is nearing the 1.0940 support level near the 2019 low. A break below that level can open the doors to the 1.0890 price level.

EUR/USD 30-minute chart
The market is trading below the main SMAs on the 30-minute chart suggesting a negative bias in the near term. Resistance is seen at the 1.0966 resistance and the 1.1000 figure, according to the Technical Confluences Indicator.

Additional key levels
