- GBP/USD seesaws between key technical levels.
- Bearish MACD, falling channel portrays the underlying momentum weakness.
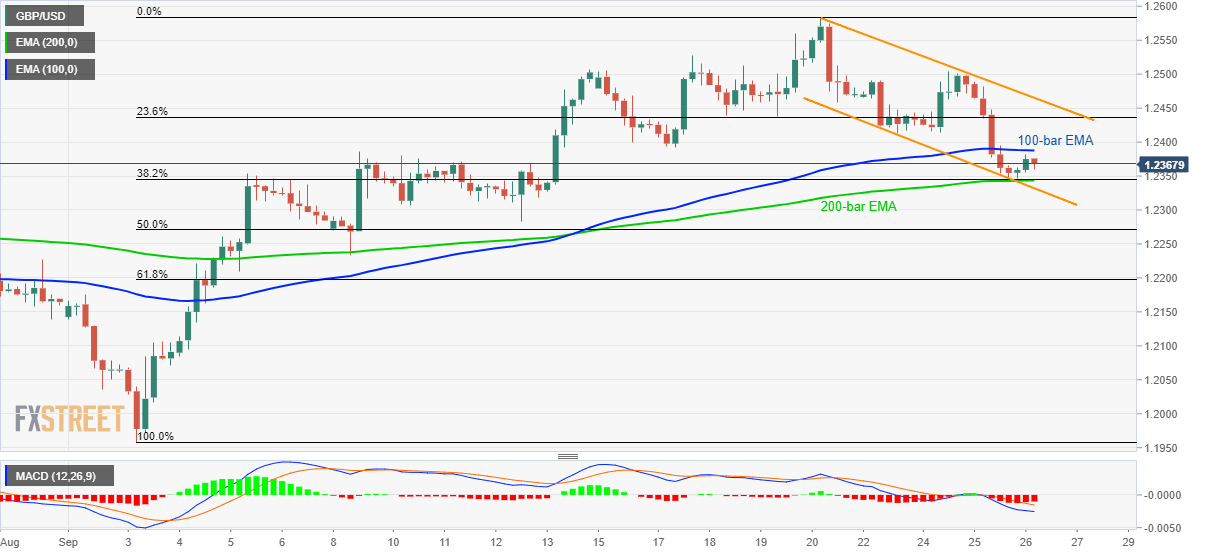
The GBP/USD pair’s recent pullback from near-term key support-confluence falls short of clearing 100-bar exponential moving average (EMA) as the pair takes rounds to 1.2360 ahead of the UK open on Thursday.
With the bearish signals from 12-bar moving average convergence and divergence (MACD) and a week-long declining trend-channel, odds are high of pair’s declines.
However, 38.2% Fibonacci retracement of current month upside and 200-bar EMA limits the pair’s immediate downside around 1.2345/40, a break of which highlights support-line of short-term falling trend-channel, at 1.2330 now.
Should the quote defies the channel formation, 1.2230 and 61.8% Fibonacci retracement level of 1.2200 gains bears’ attention.
On the upside, sustained break of 100-bar EMA level of 1.2390 can trigger fresh recovery to 1.2415 ahead of confronting channel’s resistance-line, at 1.2465.
Given the pair’s successful rise above 1.2465, 1.2500 and 1.2580/85 could lure bulls.
GBP/USD 4-hour chart
Trend: sideways
