- USD/INR seesaws near seven week low, below 50% Fibonacci retracement.
- Bearish MACD pleases bears but break of early-August low becomes necessary for further declines.
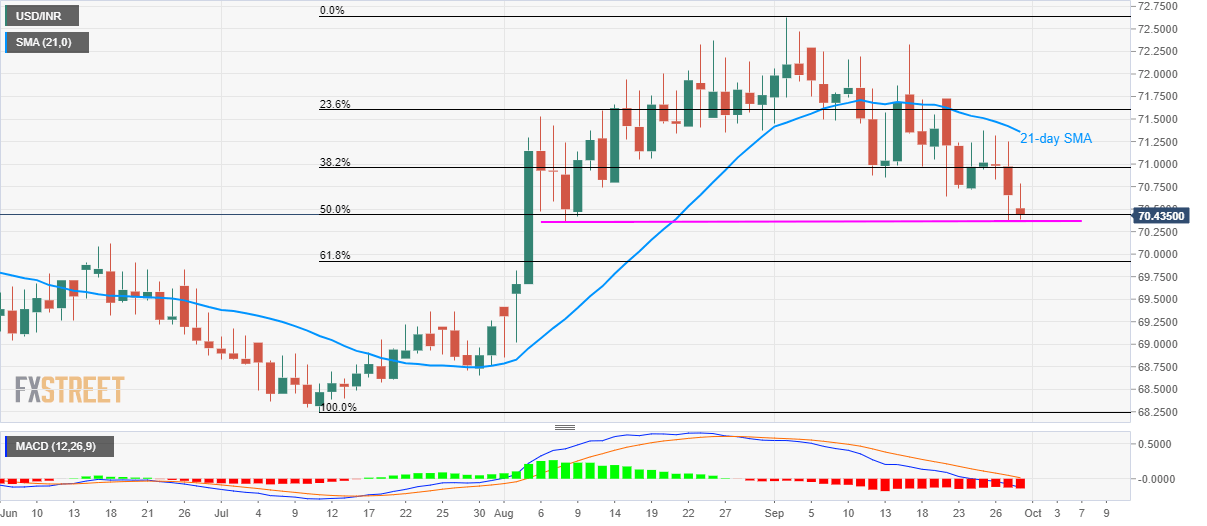
Despite trading near multi-week low, USD/INR is still to slip beneath August 08 low as it trades near 70.42 during early Monday.
In addition to pair’s sustained trading below 21-day simple moving average (SMA), bearish signal by the 12-bar moving average convergence and divergence (MACD) also favors the sellers.
Though, a clear break of August 08 low near 70.36 becomes necessary for the quote to revisit June month high nearing 70.12 and 61.8% Fibonacci retracement of July-September upside, near 69.90.
During the pair’s declines below 69.90, late-July tops surrounding 69.35 will be on the bears’ radar.
On the upside, a sustained trading beyond 50% Fibonacci retracement level of 70.45 could trigger the pair’s recovery towards 71.00 and then to 21-day SMA level of 71.35.
USD/INR daily chart
Trend: bearish
