- The Sterling/US Dollar currency pair is under pressure near the 1.2200 handle.
- The level to beat for bears is the 1.2200 handle.
- The ISM Manufacturing PMI came in below expectations at 47.8 vs. 50.1 forecast, creating a small spike on GBP/USD.
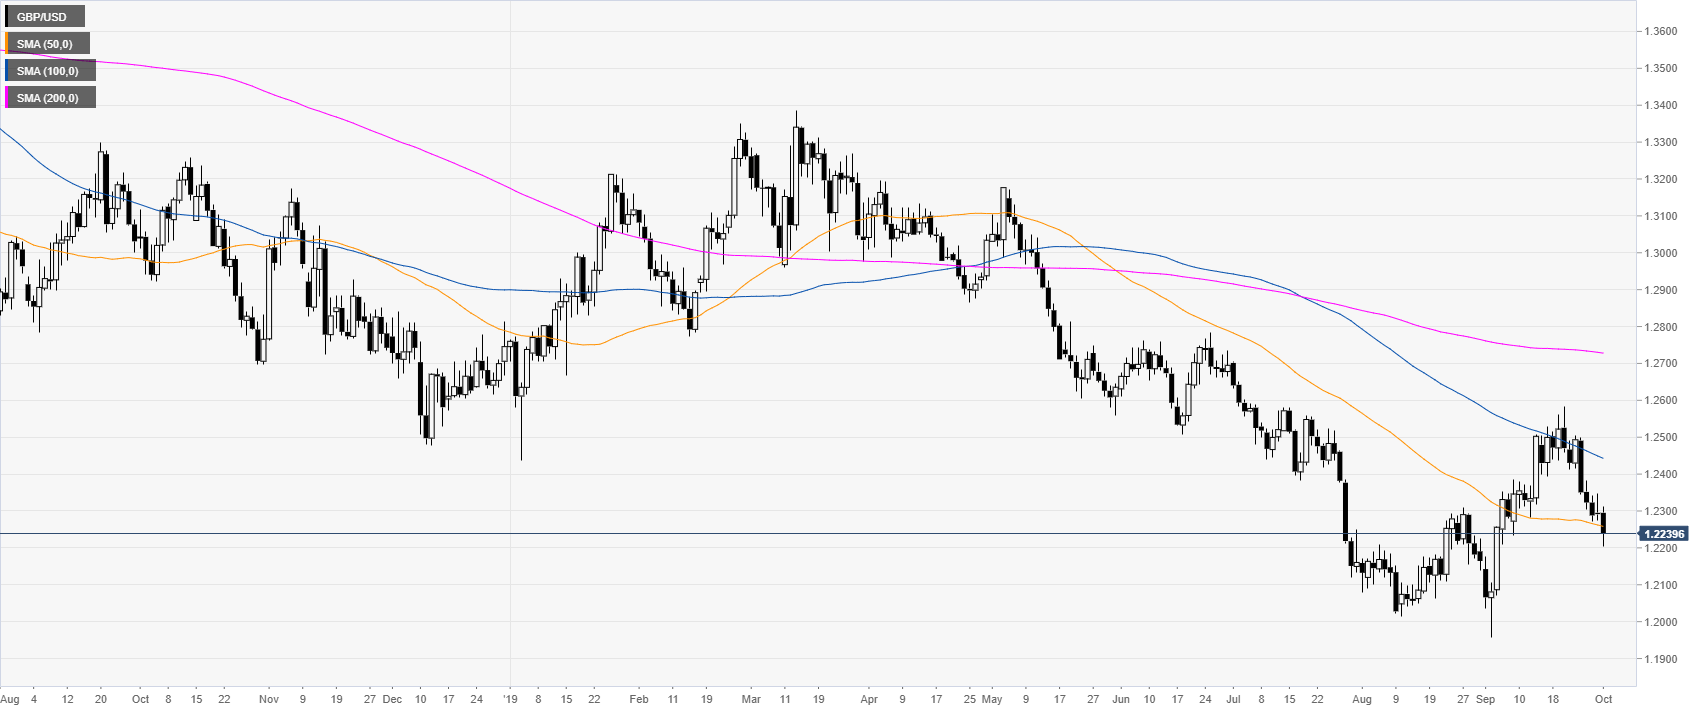
GBP/USD daily chart
The Sterling is trading in a bear trend below the main daily simple moving averages (DSMAs). The ISM Manufacturing PMI came in below expectations at 47.8 vs. 50.1 forecast, weakening USD across the board.
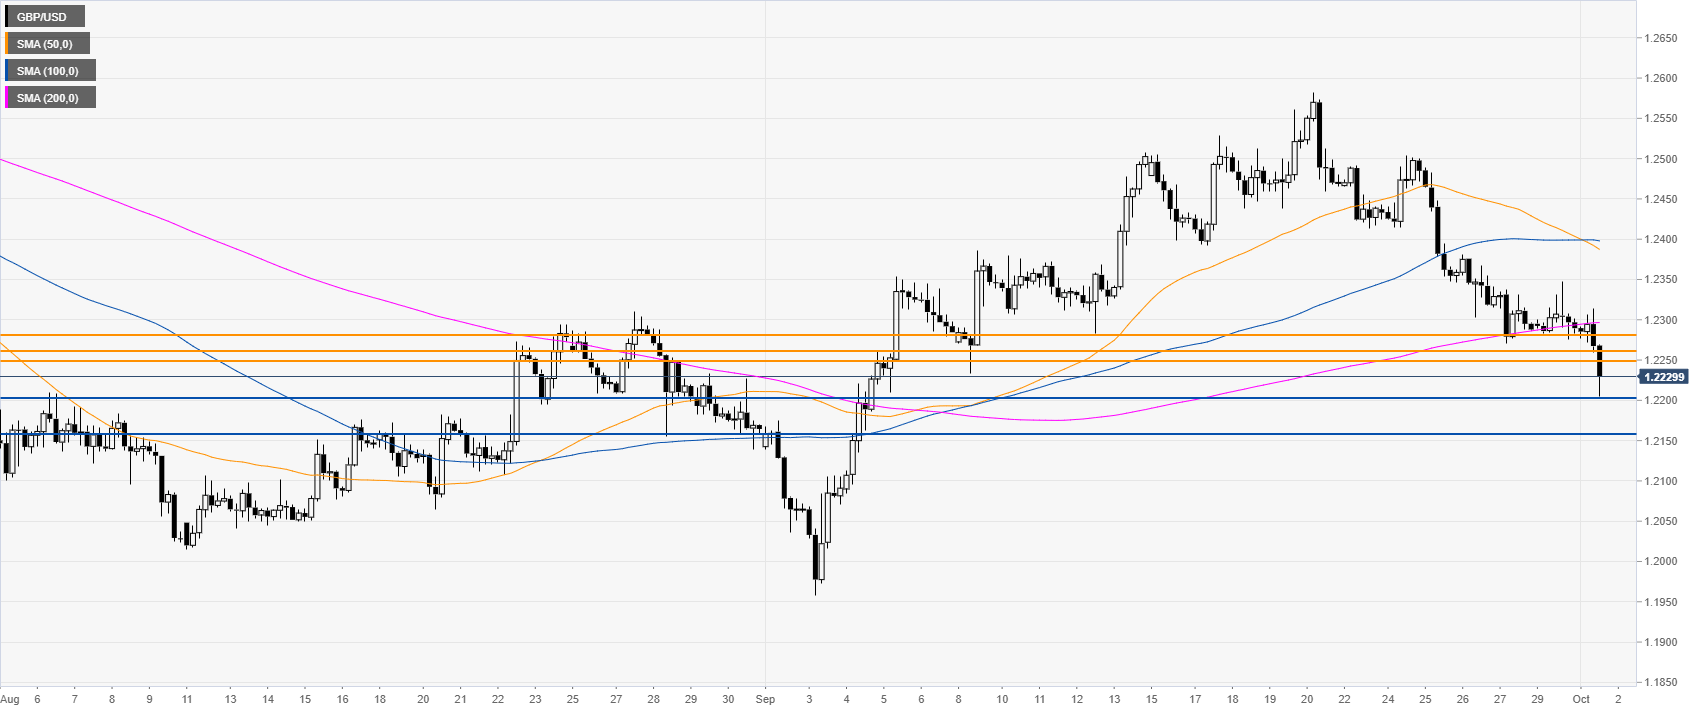
GBP/USD four-hour chart
GBP/USD is trading below its main SMAs, suggesting bearish momentum in the medium term. A break below the 1.2200 level can open the doors to the 1.2157 support, according to the Technical Confluences Indicator.
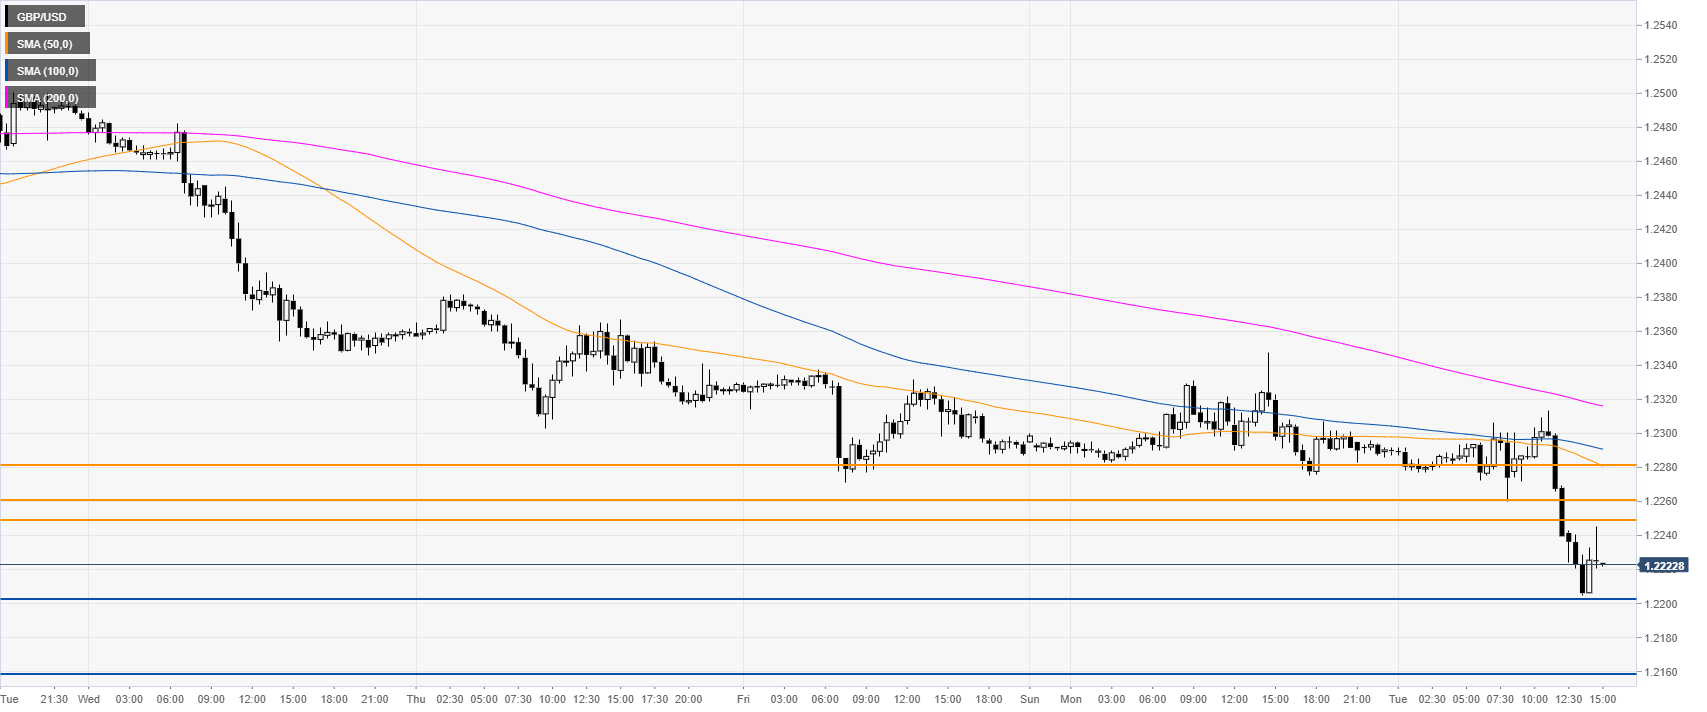
GBP/USD 30-minute
The Pound/US Dollar exchange is trading below its main SMAs on the 30-minute chart, suggesting a bearish bias in the short term. Immediate resistances are seen at the 1.2247 level and 1.2260/80 levels, according to the Technical Confluences Indicator.
Additional key levels
