- GBP/USD is ending Friday and the week virtually unchanged.
- The level to beat for sellers is seen at the 1.2275 support.
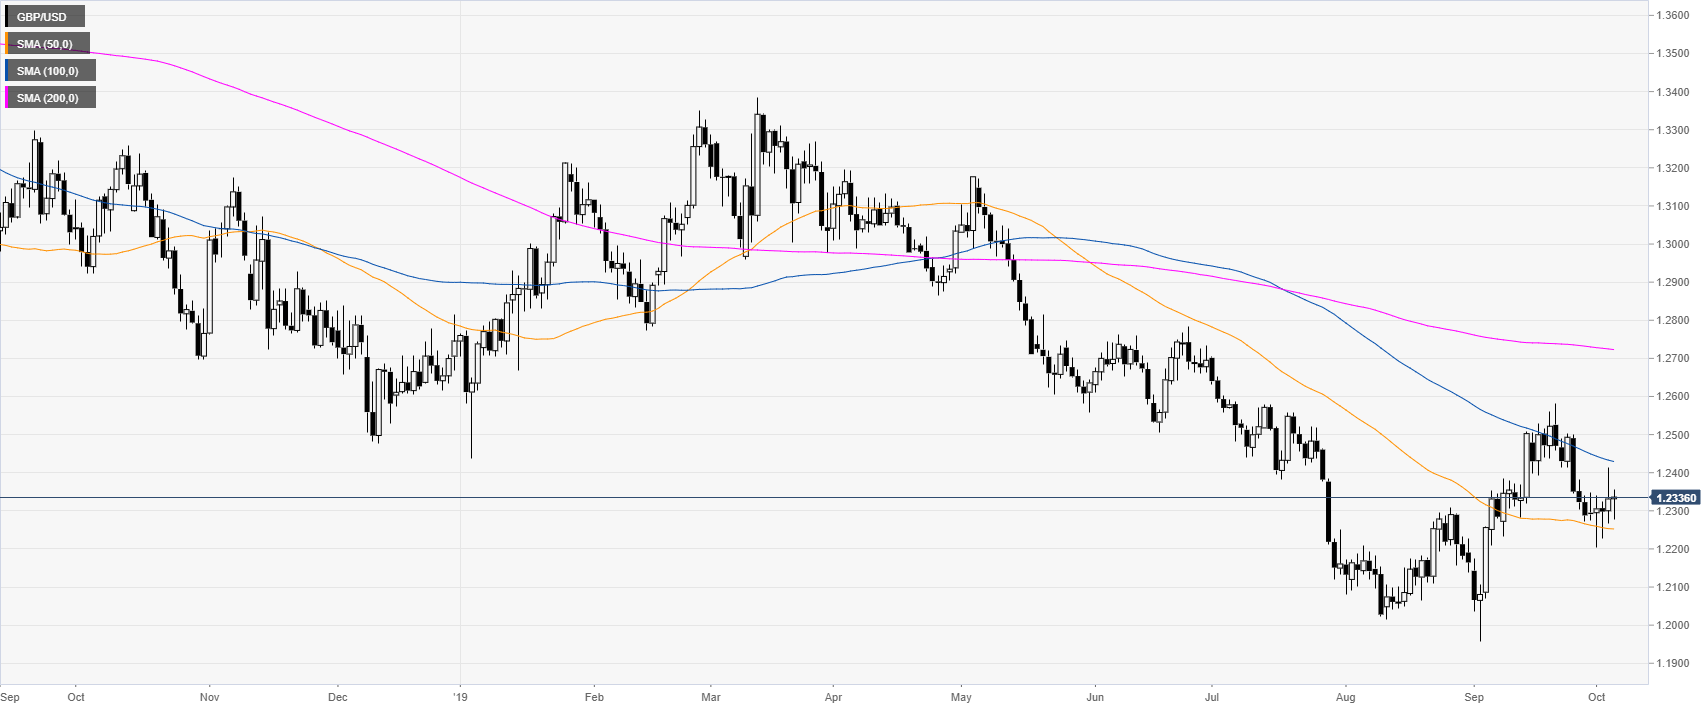
GBP/USD daily chart
The Pound is trading in a bear trend below the 100 and 200-day simple moving averages (DSMAs). The market is currently trapped between the 50 SMA at 1.2252 and the 1.2400 figure.
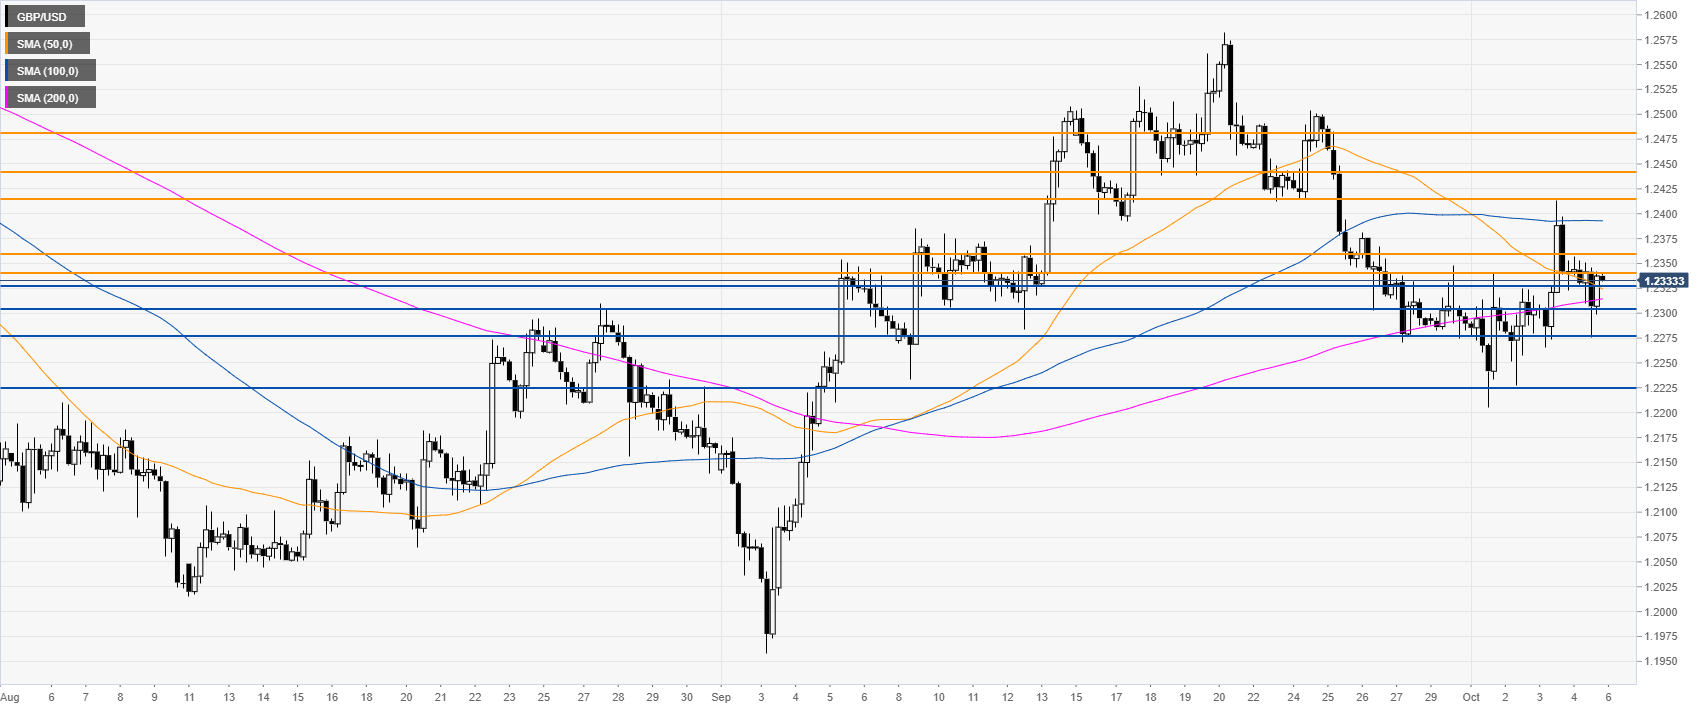
GBP/USD four-hour chart
GBP/USD is retracing the bull spike to the 1.2400 figure as the market is having swings in both directions. However, the downside seems to prevail as a break below1.2305/1.2275 can lead to 1.2224 support level, according to the Technical Confluences Indicator.
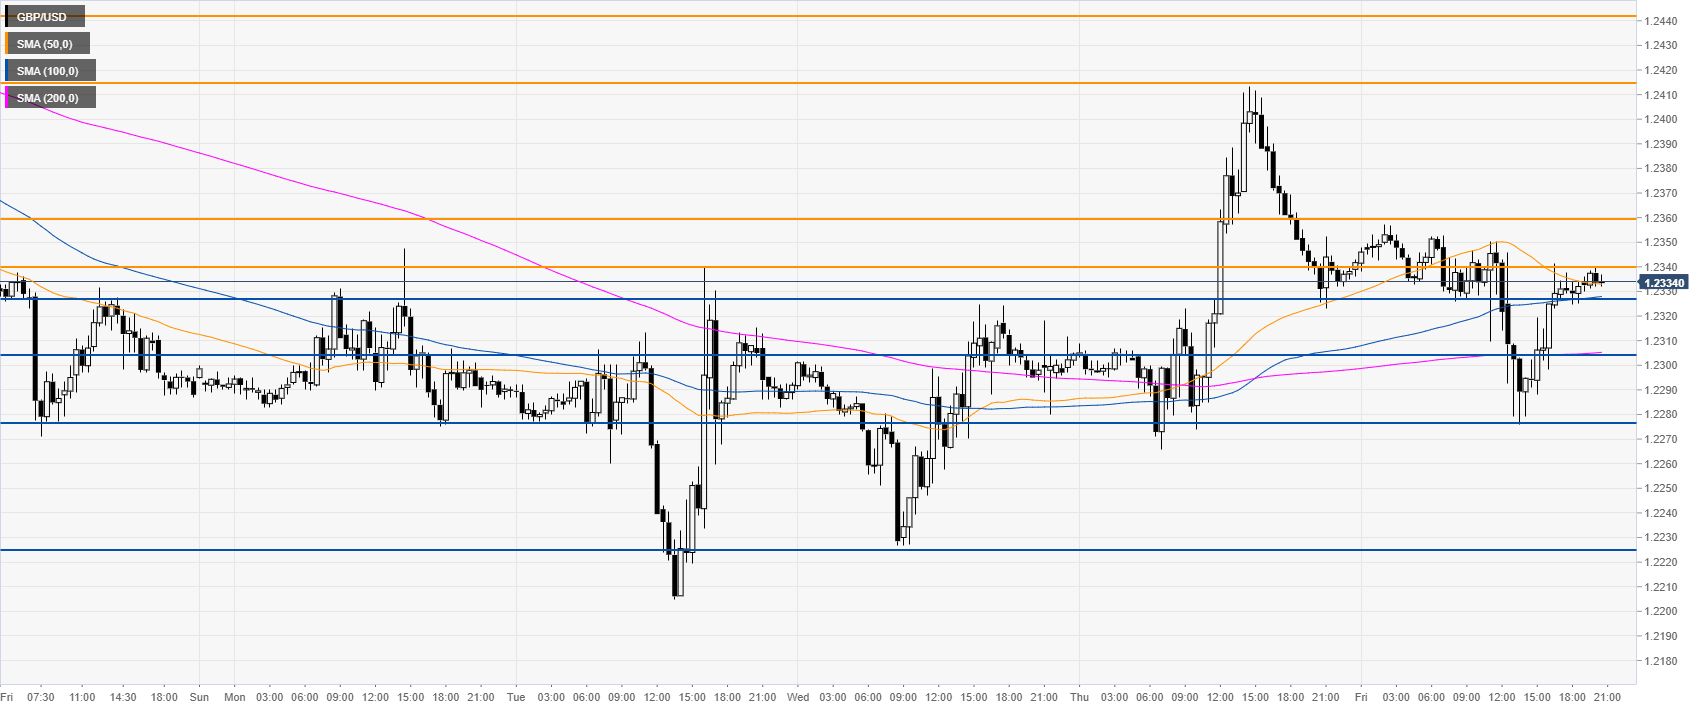
GBP/USD 30-minute
The Pound/US Dollar exchange rate is challenging the 1.2340 resistance. If broken, the 1.2360 level is likely the next level to watch. Further up lie 1.2412 resistance, according to the Technical Confluences Indicator.
Additional key levels
