- EUR/USD is trading above 1.1069 as the New York session comes to an end.
- On Wednesday, the Retail Sales Control Group in the United States came out below expectations at 0% vs. 0.3% in September, adding to the negative sentiment on the Greenback.
- The Euro is trading at levels not seen since mid-September.
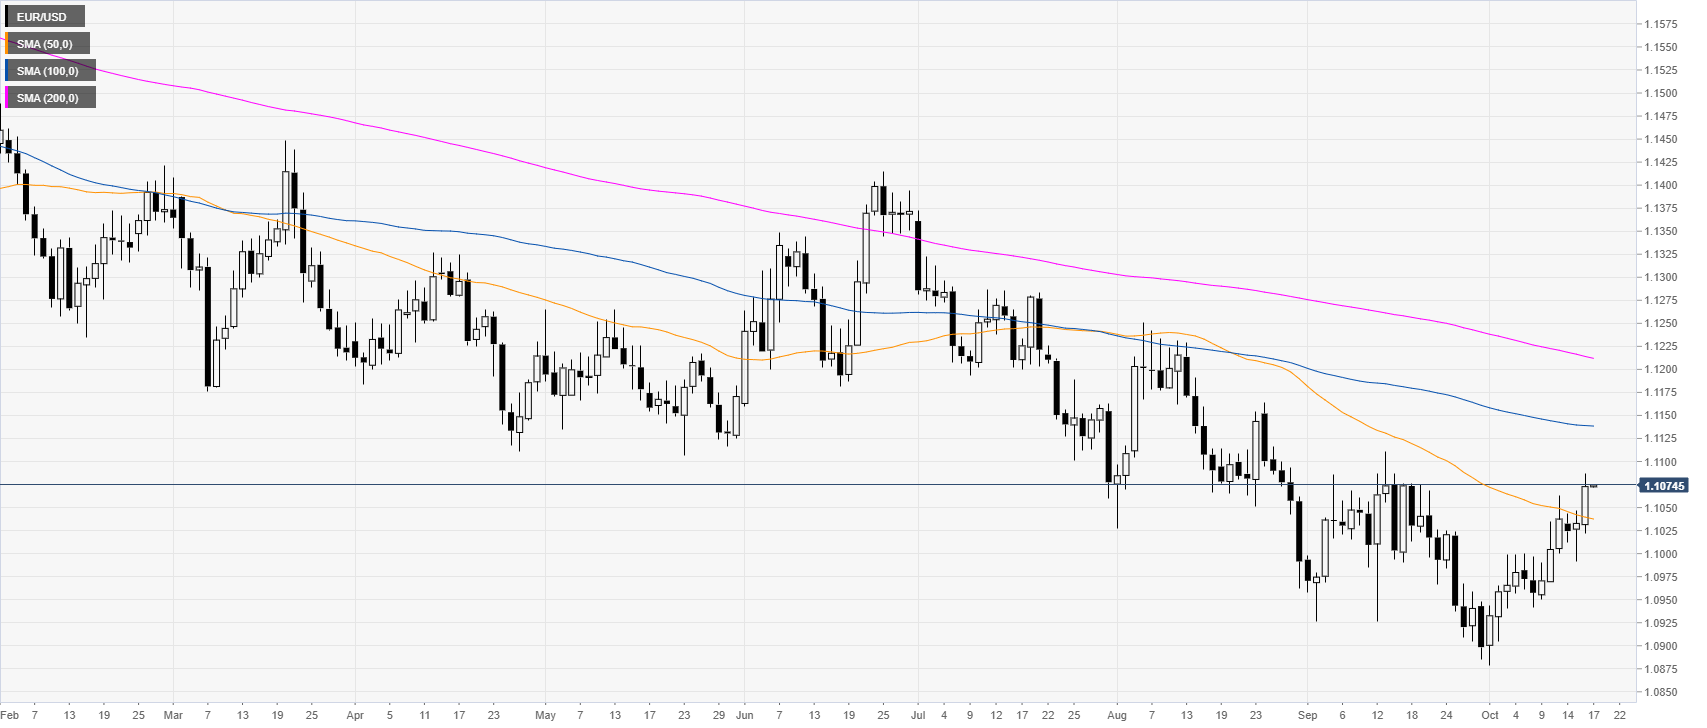
EUR/USD daily chart
On the daily chart, the common currency is trading in a downtrend below the 100 and 200-day simple moving averages (DSMAs). The Fiber is trading at levels not seen since mid-September. Moreover, the Retail Sales Control Group in the United States came out below expectations at 0% vs. 0.3% for September, reinforcing the negative sentiment on the Greenback.
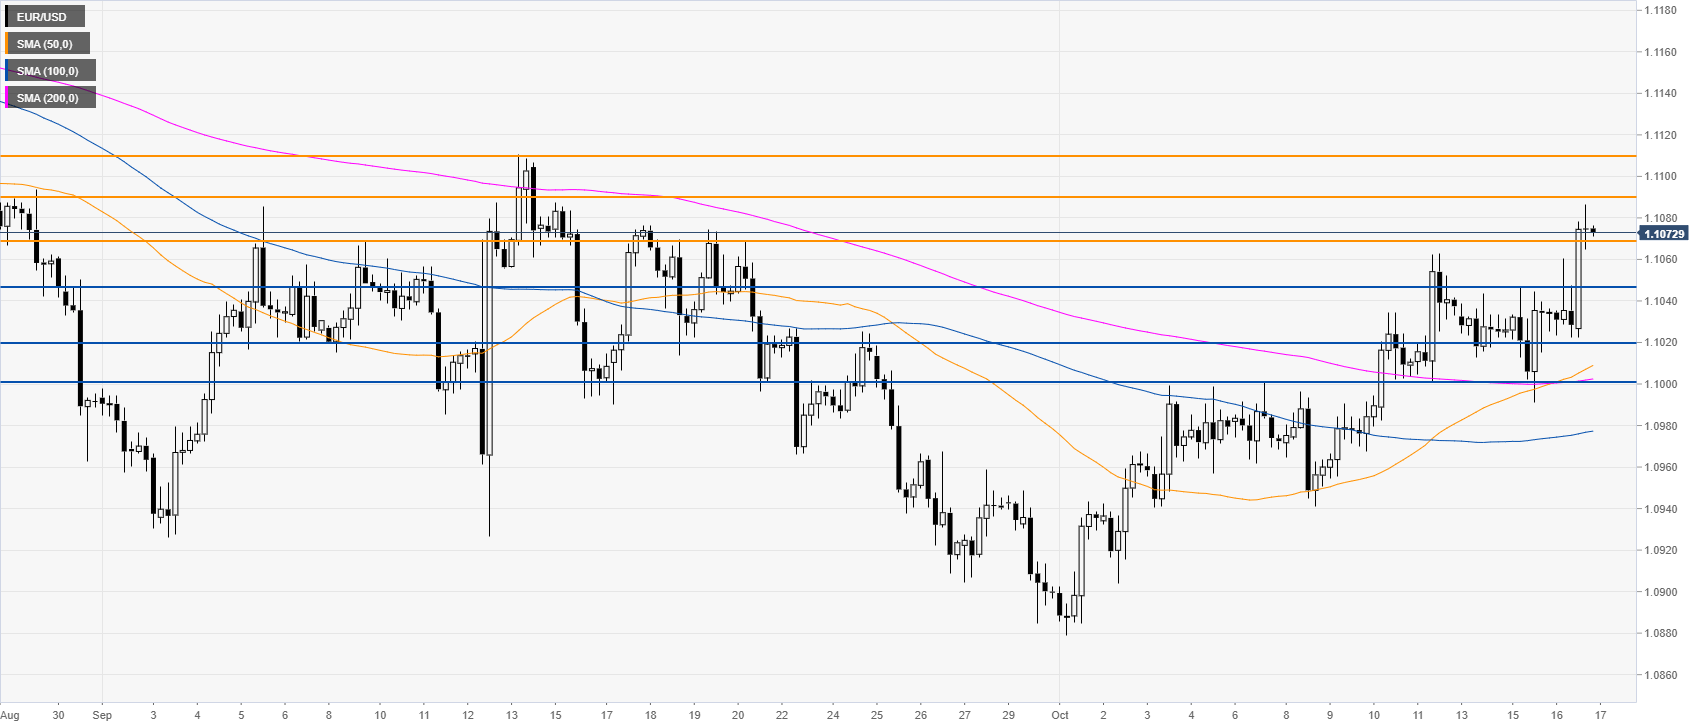
EUR/USD four-hour chart
The Fiber is trading above its main SMAs, suggesting bullish momentum in the medium term. EUR/USD ended Wednesday above the 1.1069 resistance, which can lead to further gains towards the 1.1100 level, according to the Technical Confluences Indicator.
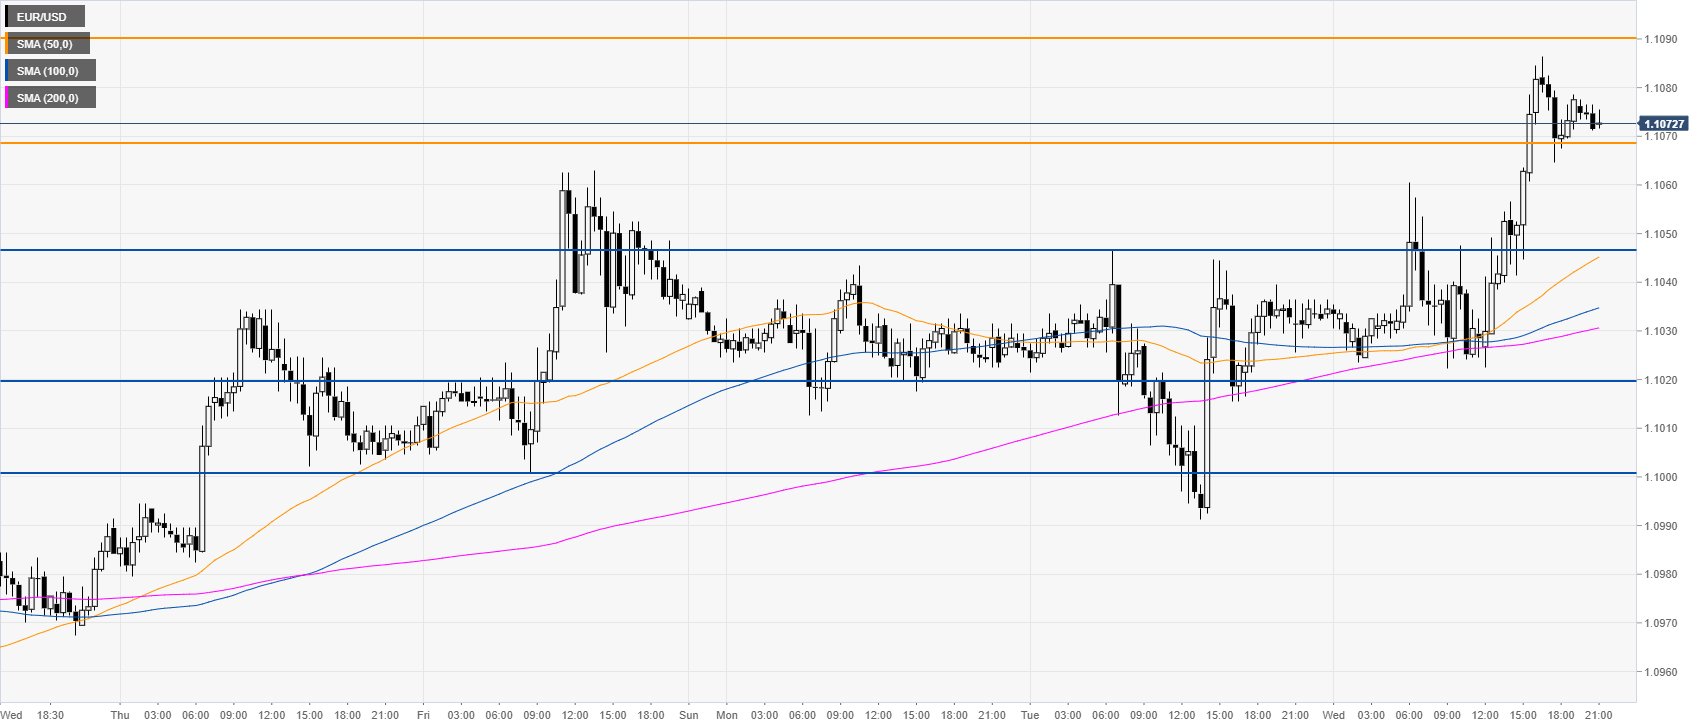
EUR/USD 30-minute chart
EUR/USD is trading above its main SMAs, suggesting bullish momentum in the near term. Support can be seen at 1.069, 1.1046 and 1.1020 price levels.
Additional key levels
