- GBP/USD pullback from multi-month high amid downbeat signals from RSI, MACD.
- The four-day-old rising trend-line, 50-bar SMA question immediate declines.
With the short-term rising trend-line and Simple Moving Average (SMA) confronting bearish oscillators, GBP/USD takes the rounds to 1.2850 ahead of the London open on Friday.
Not only overbought conditions of the 14-bar Relative Strength Index (RSI) but a bearish sign from 12-bar Moving Average Convergence and Divergence (MACD) also favors sellers.
However, a downside break of 1.2805 becomes necessary for bears to target September high nearing 1.2583 and 50-bar Simple Moving Average (SMA) level of 1.2553.
In the absence of a downturn below immediate supports, prices can keep 1.3000 on the radar whereas May’s top of 1.3178 could become the next landmark for buyers.
GBP/USD 4-hour chart
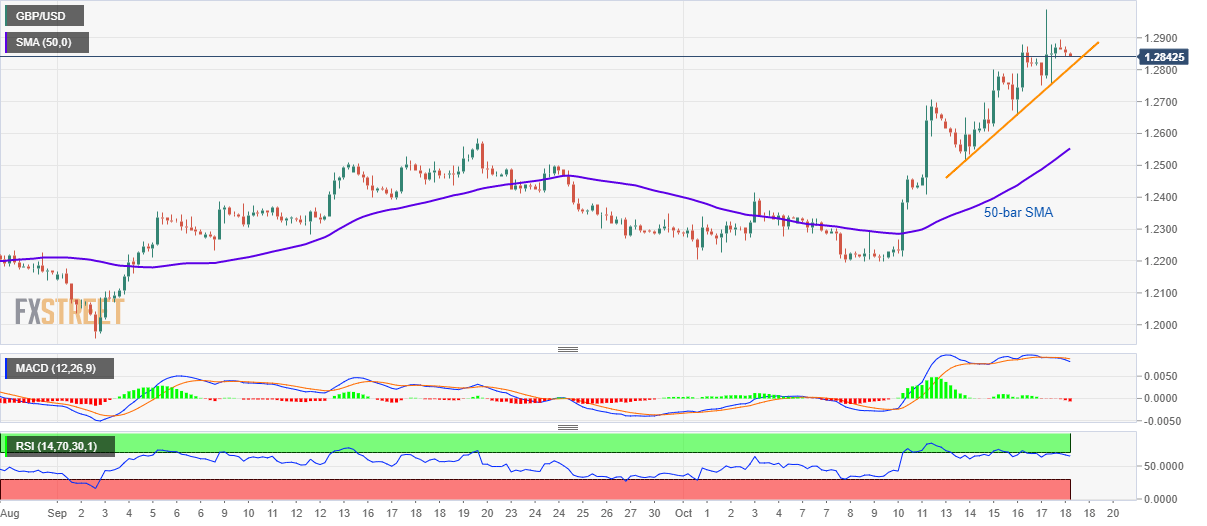
Trend: sideways
