- GBP/USD stays on the back foot below 50-bar SMA.
- Prices form a falling channel pattern since reversing from early-week high.
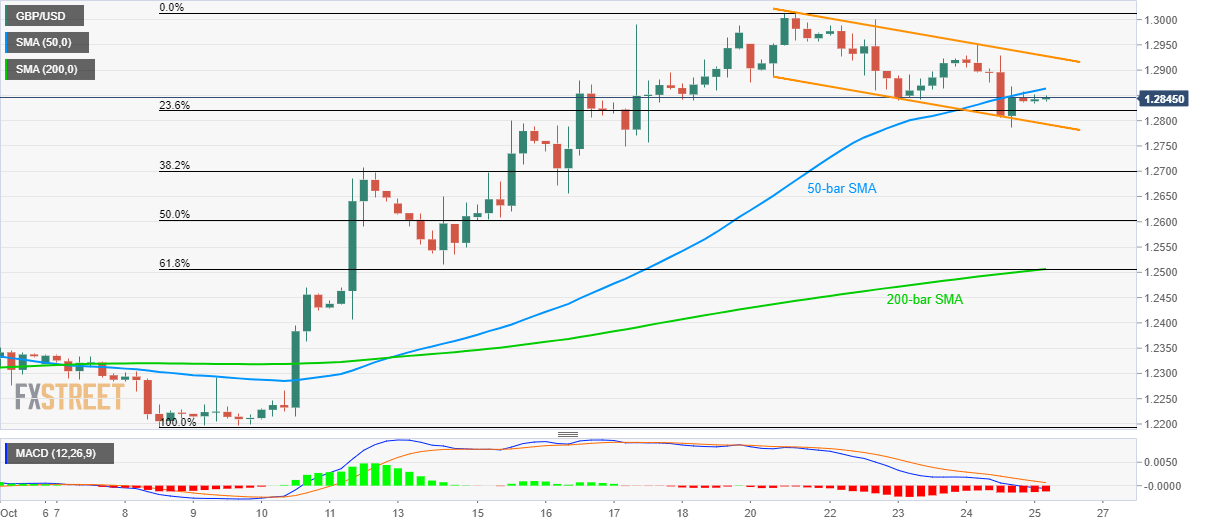
Ever since Monday’s U-turn, GBP/USD forms a short-term falling trend-channel that directs short-term moves as it trades near 1.2845 ahead of the London open on Friday.
The quote recently bounced off the formation’s support-line, at 1.2790 now, but failed to cross 50-bar Simple Moving Average (SMA) level of 1.2865.
Should prices rise above 1.2865, the channel’s resistance line near 1.2930 could question buyers targeting a break above 1.3000 round-figure.
On the contrary, pair’s decline below 1.2790 support can favor sellers to aim for October 11 high close to 1.2710.
However, 1.2500 mark comprising 200-bar SMA and 61.8% Fibonacci retracement of the current month upside could keep the bears under check.
GBP/USD 4-hour chart
Trend: bearish
