- USD/CAD traders near three-month low with the MACD flashing bearish signals.
- Multiple lows marked since October 18, 2018, highlights the 1.3016/15 area as the key support.
With the bearish signal from 12-bar Moving Average Convergence and Divergence (MACD) favoring further downside of the USD/CAD pair, one-year-old horizontal support gains market attention. The quote seesaws around 1.3060 by the press time of early Monday.
Following its gradual decline since October 10, which drags it below 61.8% Fibonacci retracement of late-2018 upside, the pair bears now seem to wait for the key horizontal support around 1.3016/15 to break in order to exert further downside pressure.
In doing so, an extended south-run below 1.3000 will validate the pair’s drop to 1.2915 and October 2018 monthly low near 1.2780.
Meanwhile, the pair’s rise above 61.8% Fibonacci retracement level of 1.3122 will set the tone for pair’s recovery towards 1.3150 and early-month lows near 1.3300.
USD/CAD daily chart
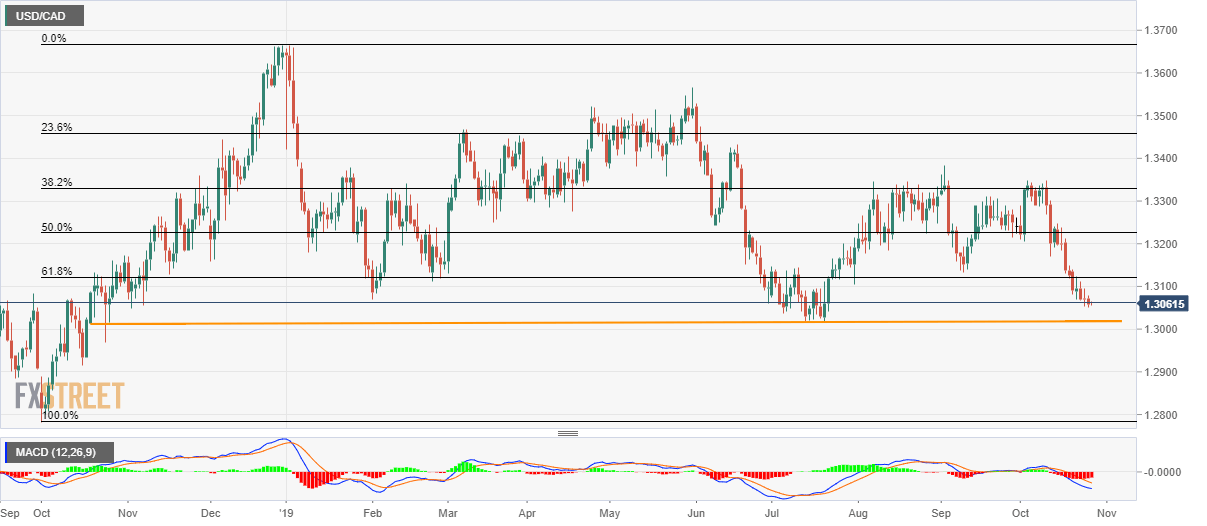
Trend: bearish
