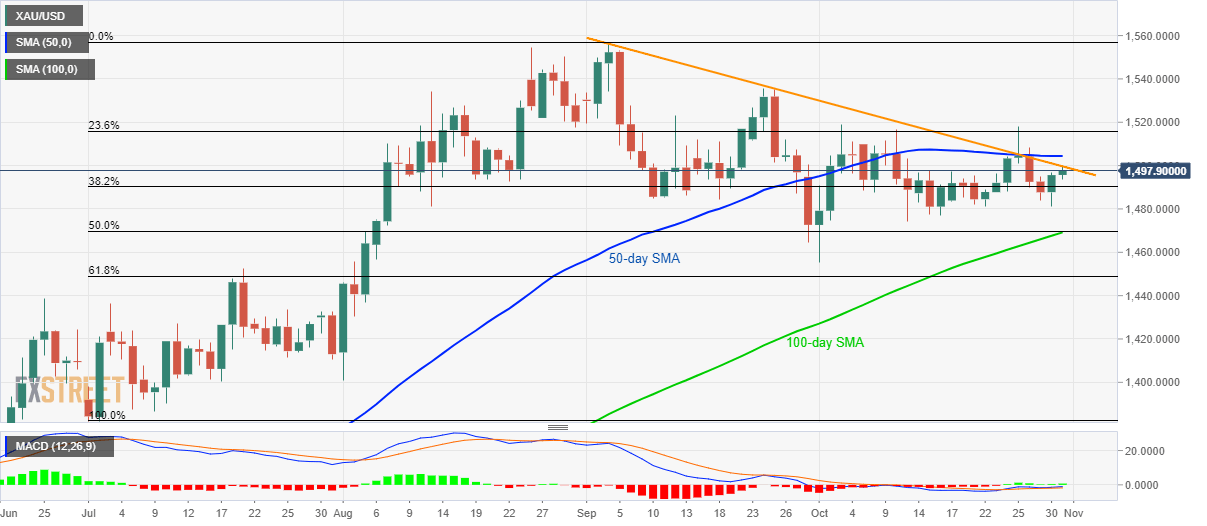
- Gold again rises to the short-term falling resistance line, near to 50-day SMA.
- Bullion’s downside below $1,469 will be the key.
Having bounced off a week’s low, Gold prices challenge immediate key resistances while taking the bids to $1,497 amid pre-European session trading on Thursday.
Not only a downward sloping trend line since early-September, at $1,500, a 50-day Simple Moving Average (SMA) level of $1,505 also restrict the yellow metal’s nearby upside.
In a case, the quote manages to stay strong beyond $1,505, $1,518 and $1,535/36 could entertain buyers ahead of pleasing them with $1,557 mark including September month high.
Meanwhile, $1,481 is likely adjacent support hold the safe-haven’s declines confined prior to shifting market focus on 100-day SMA and 50% Fibonacci retracement of July-September upside, near $1,469.
However, bears’ entry below $1,469 will be the key as it can recall $1,455 and 61.8% Fibonacci retracement level of $1,448 on the charts.
Gold daily chart
Trend: pullback expected
