GBP/USD is trading above 1.29 but off the highs, as politics remain center stage, but also Purchasing Managers’ Indexes are eyed. How is the currency pair positioned on the charts?
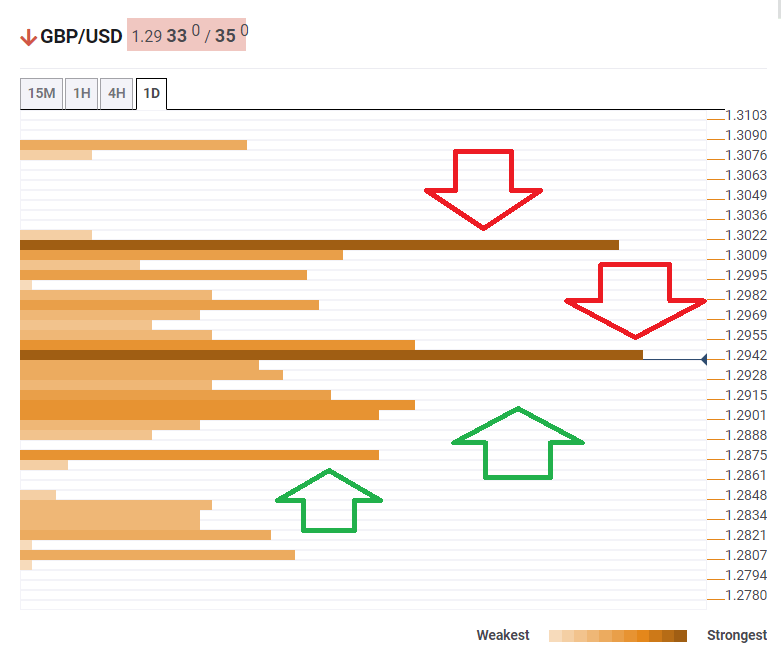
The Technical Confluences Indicator is showing that GBP/USD is capped by robust resistance at 1.2942, which is a dense cluster of lines including the Simple Moving Average 5-15m, the Fibonacci 23.6% one-week, the Fibonacci 23.6% one-day, the previous 1h-high, the SMA 5-4h, and the Bollinger Band 1h-Middle.
Further up, it faces another hurdle of the same magnitude at 1.3013, which is the convergence of the Pivot Point one-day Resistance 3, the previous monthly high, the PP 1w-R1, and the Fibonacci 161.8% one-day.
Some support awaits at 1.2908, which is where the PP 1d-S2 and the SMA 5-one-day meet.
Further down, weak support is at 1.2875, which is where the BB 4h-Lower and the Fibonacci 61.8% one-week converge.
This is how it looks on the tool:
Confluence Detector
The Confluence Detector finds exciting opportunities using Technical Confluences. The TC is a tool to locate and point out those price levels where there is a congestion of indicators, moving averages, Fibonacci levels, Pivot Points, etc. Knowing where these congestion points are located is very useful for the trader, and can be used as a basis for different strategies.
This tool assigns a certain amount of “weight” to each indicator, and this “weight” can influence adjacents price levels. This means that one price level without any indicator or moving average but under the influence of two “strongly weighted” levels accumulate more resistance than their neighbors. In these cases, the tool signals resistance in apparently empty areas.
Learn more about Technical Confluence
