- EUR/USD remains trapped in tiny ranges in the second part of the week.
- The level to beat for sellers is the 1.0995 support level.
- Resistance is seen at the 1.1024 and 1.1052 levels.
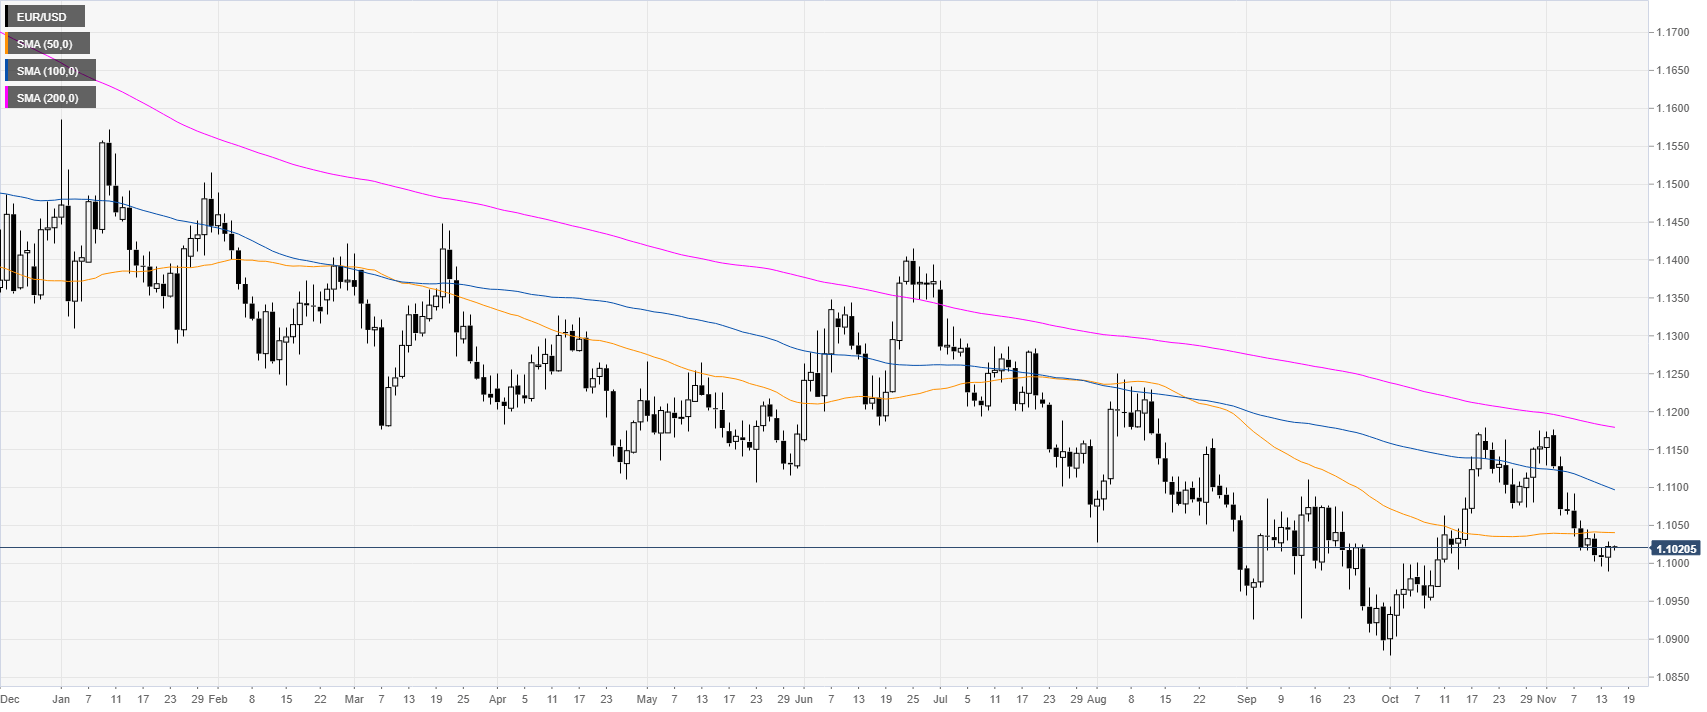
EUR/USD daily chart
The Euro, on the daily chart, is trading in a downtrend below the main daily simple moving averages (DMAs). This Thursday, the market traded mainly sideways with a spike at the end of the London session.
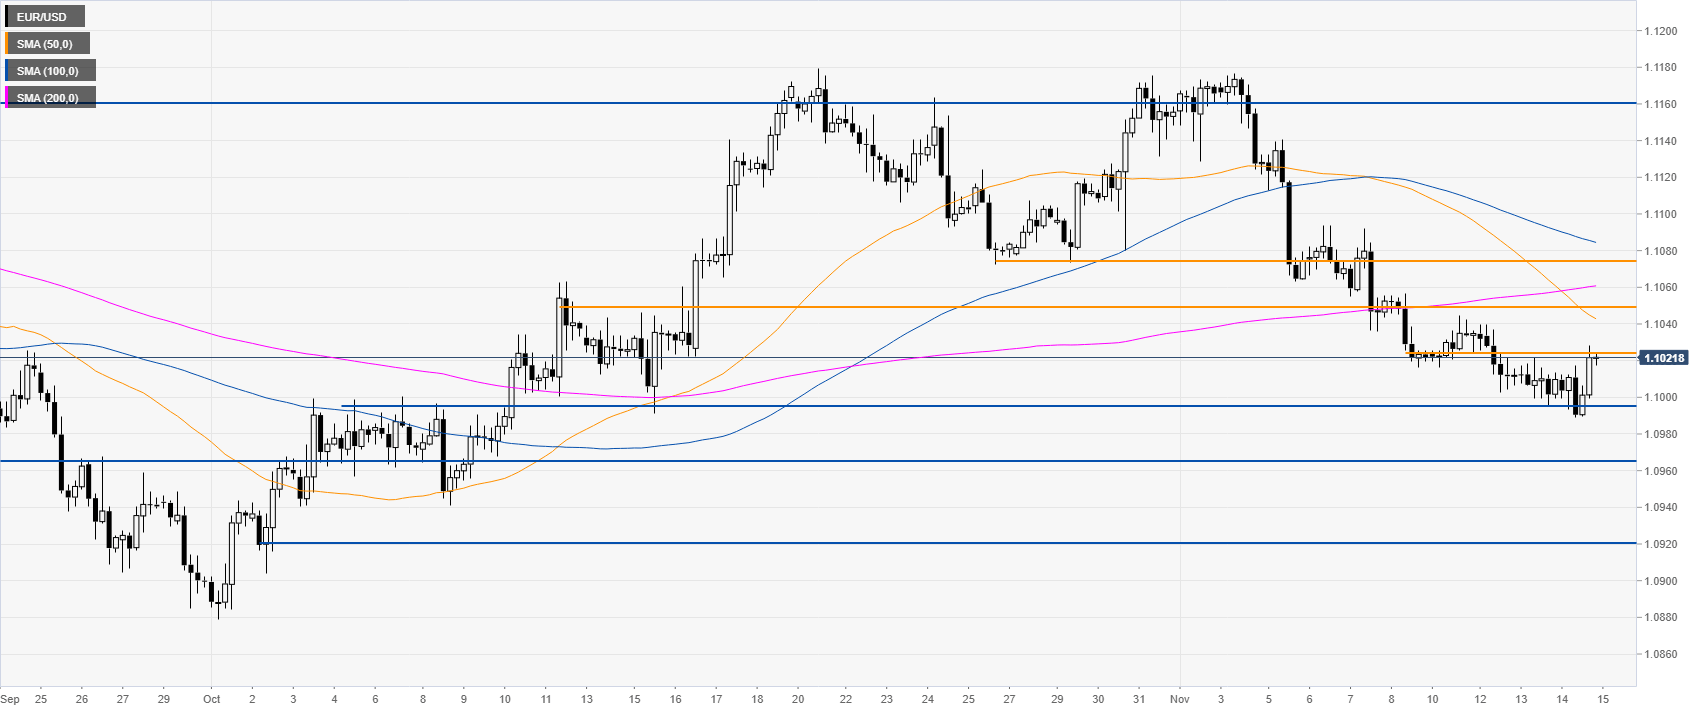
EUR/USD four-hour chart
The market is trading below the main SMAs, suggesting a bearish bias in the medium term. The spot is likely to stay under bearish pressure below the 1.1024 resistance level as EUR/USD remains predominantly weak and could see an extension of the down move towards the 1.0995, 1.0966 and 1.0920 support levels, according to the Technical Confluences Indicator.
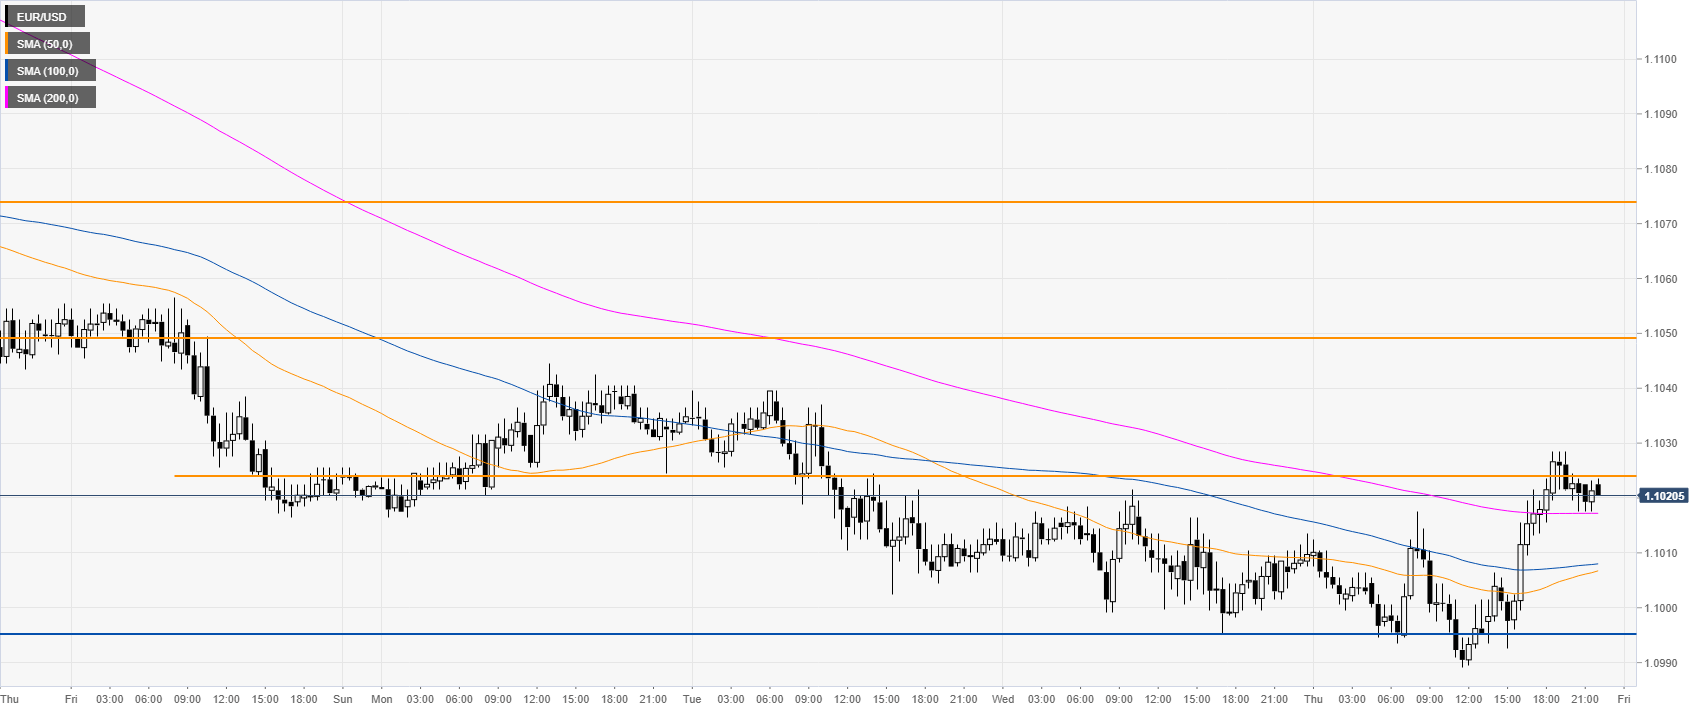
EUR/USD 30-minute chart
The Euro rose above its main SMAs on the 30-minute chart, suggesting a potential correction up in the near term. Resistances can be seen at the 1.1024, 1.1052 and 1.1075 price levels, according to the Technical Confluences Indicator.
Additional key levels
