- EUR/JPY has been slowly grinding up since the start of the week.
- Resistance is seen at the 120.45/63 price zone.
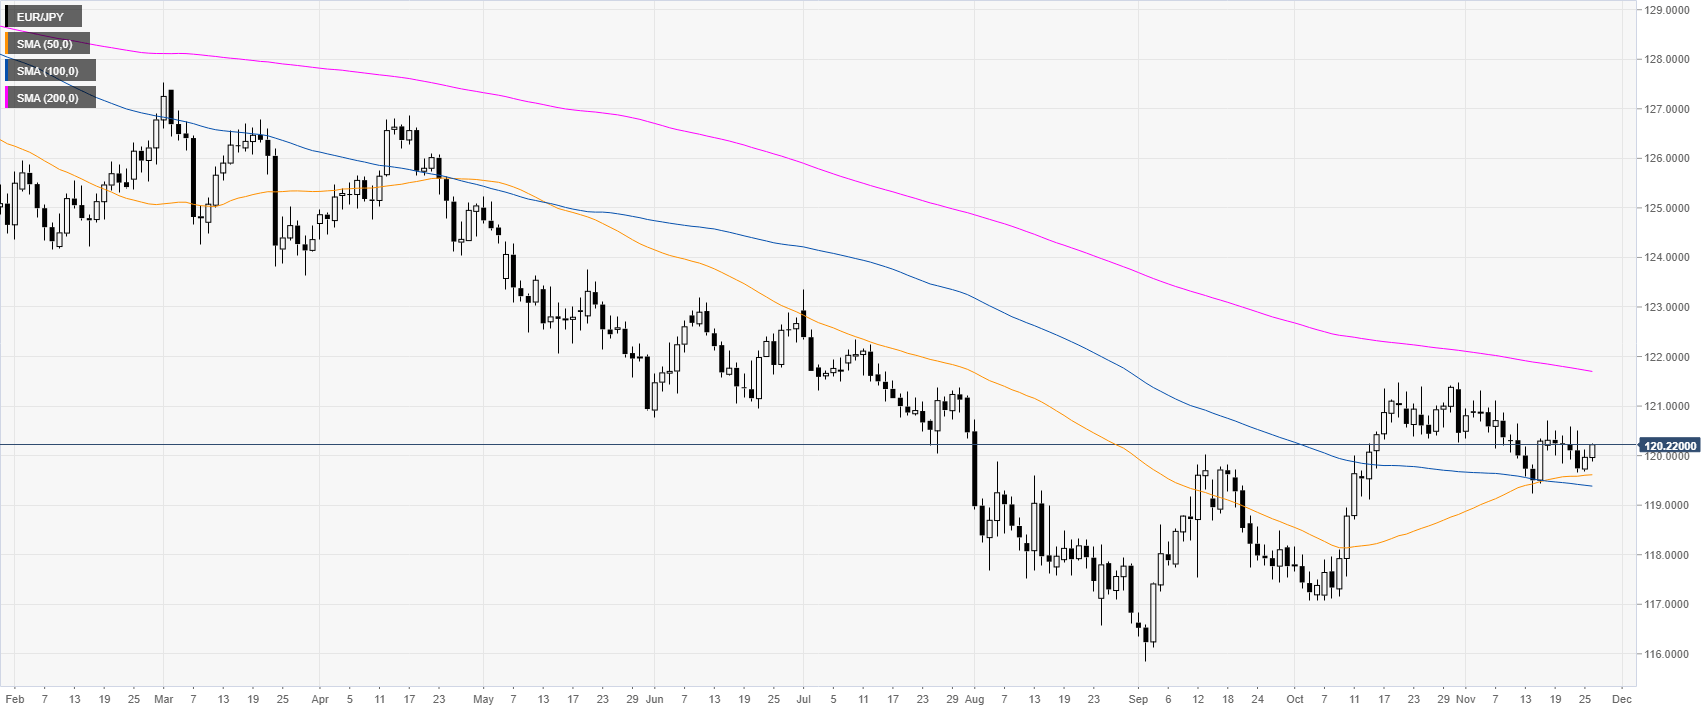
EUR/JPY daily chart
EUR/JPY is trading in a downtrend below the 200-day simple moving average (DMA). The market is currently consolidating the October bull run as the market stays capped by the 121.00 handle.
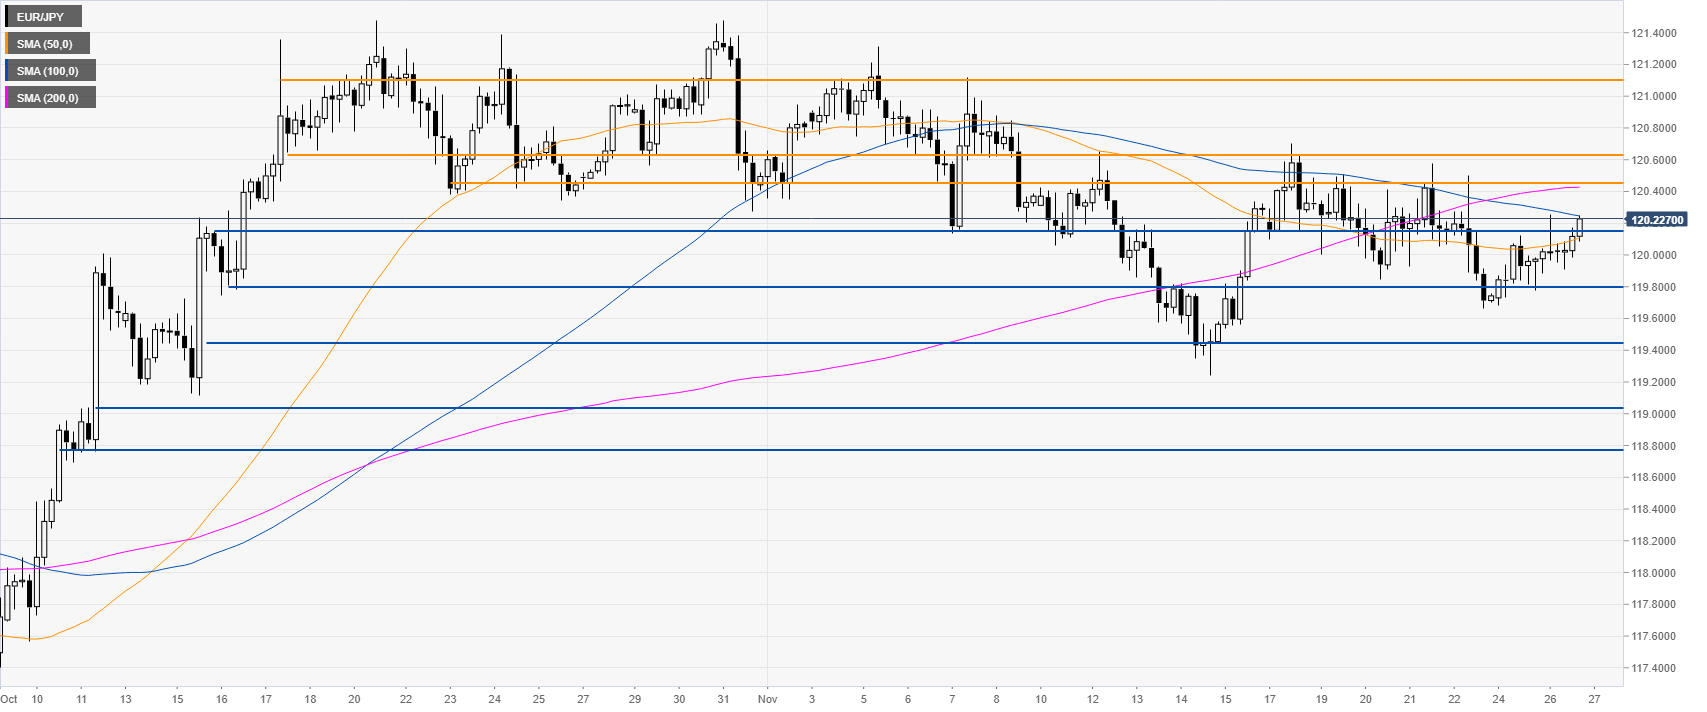
EUR/JPY four-hour chart
The market is grinding up above the 120.00 while challenging the 100 SMA. If the spot holds above 120.15, the current move can extend to the 120.45/63 resistance zone near the 200 SMA, according to Technical Confluences Indicator.
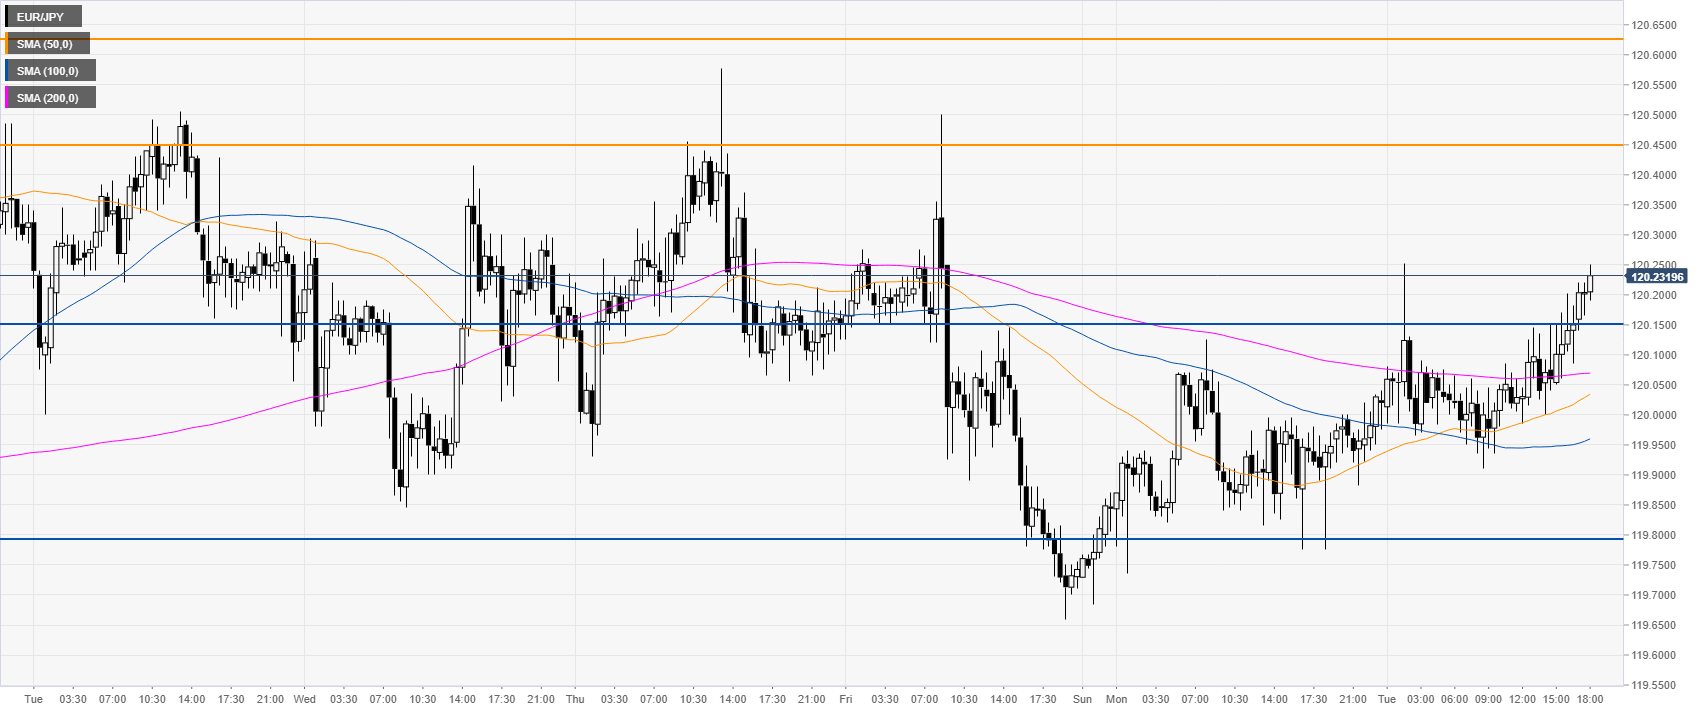
EUR/JPY 30-minute chart
The cross is advancing above its main SMAs, suggesting a bullish bias in the near term. Support is seen at the 120.15 and 119.80 price levels, according to Technical Confluences Indicator.
Additional key levels
