- The cable is trading mixed this week fighting for the 1.2900 handle.
- The level to beat for sellers is the 1.2820 level.
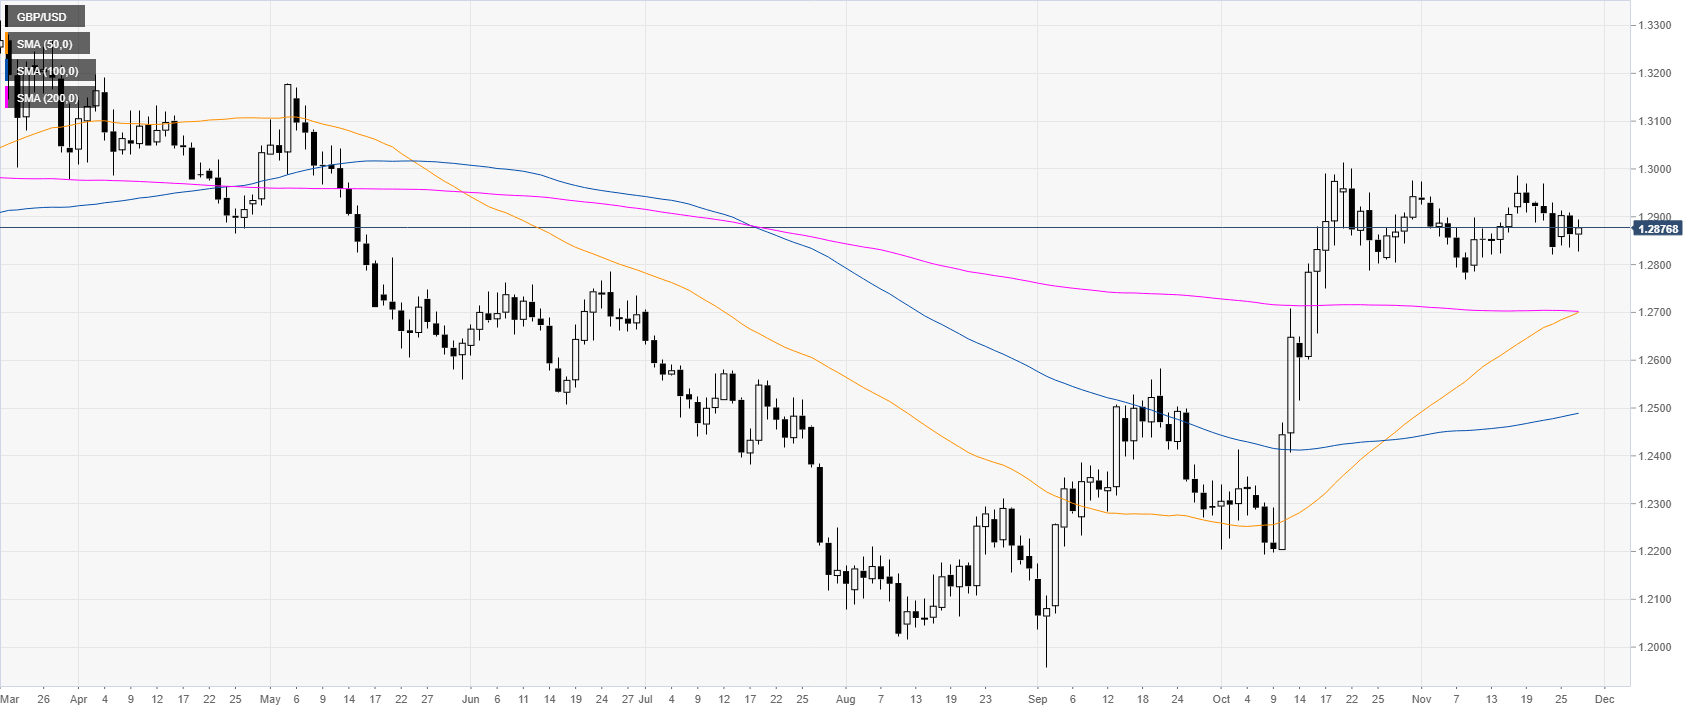
GBP/USD daily chart
GBP/USD is battling for the 1.2900 handle as the market is correcting the massive October’s rally. However, the market keeps an underlying bullish bias while above the main daily simple moving averages (DMAs).
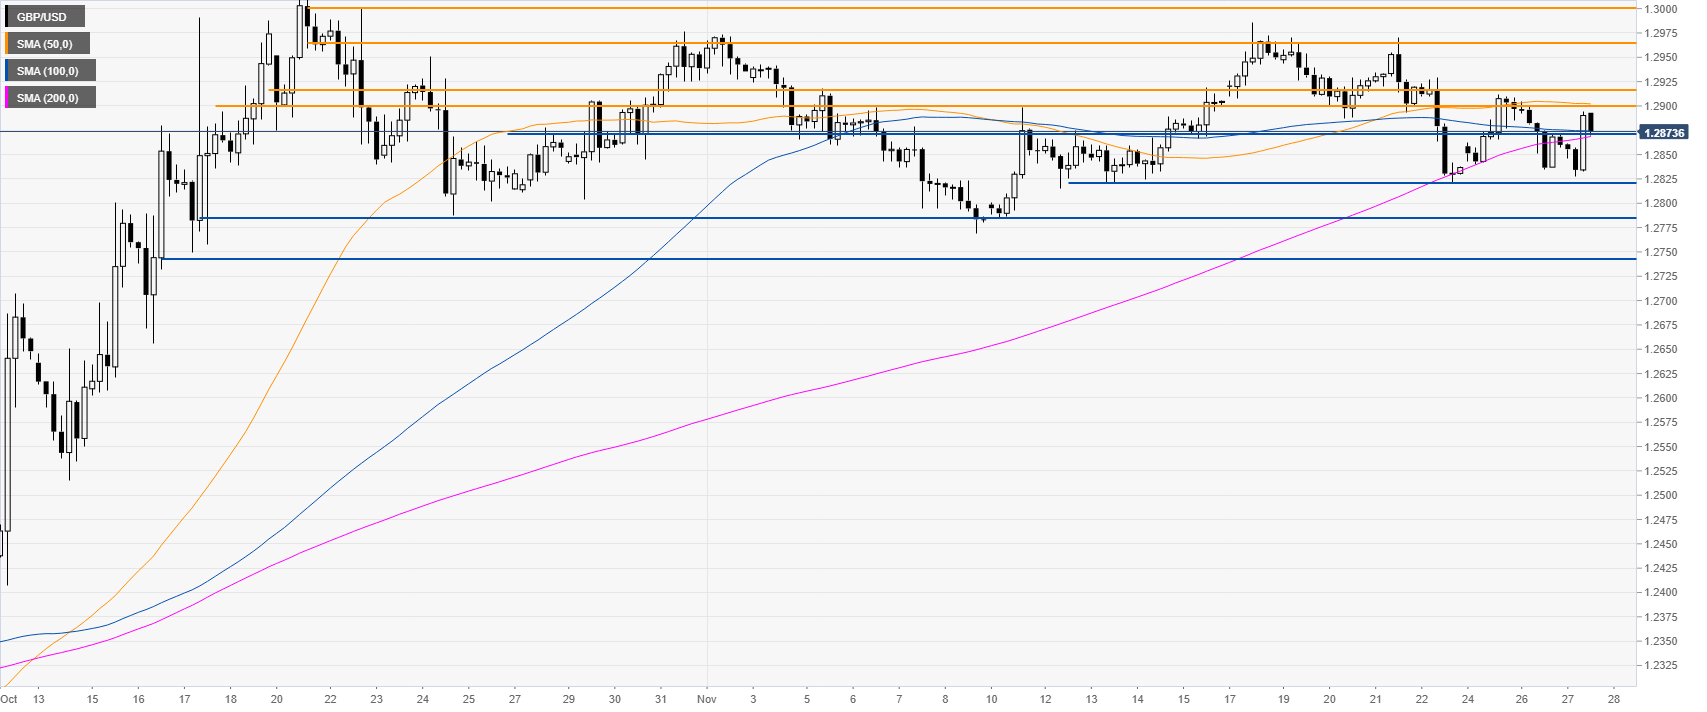
GBP/USD four-hour chart
The spot is trading just below the 1.2900 figure and the 50 SMAs, suggesting a mild bearish bias in the medium term. A break below 1.2870 and 1.2820 could attract selling interest and drive the market towards the 1.2785 and 1.2742 price levels, according to the Technical Confluences Indicator.
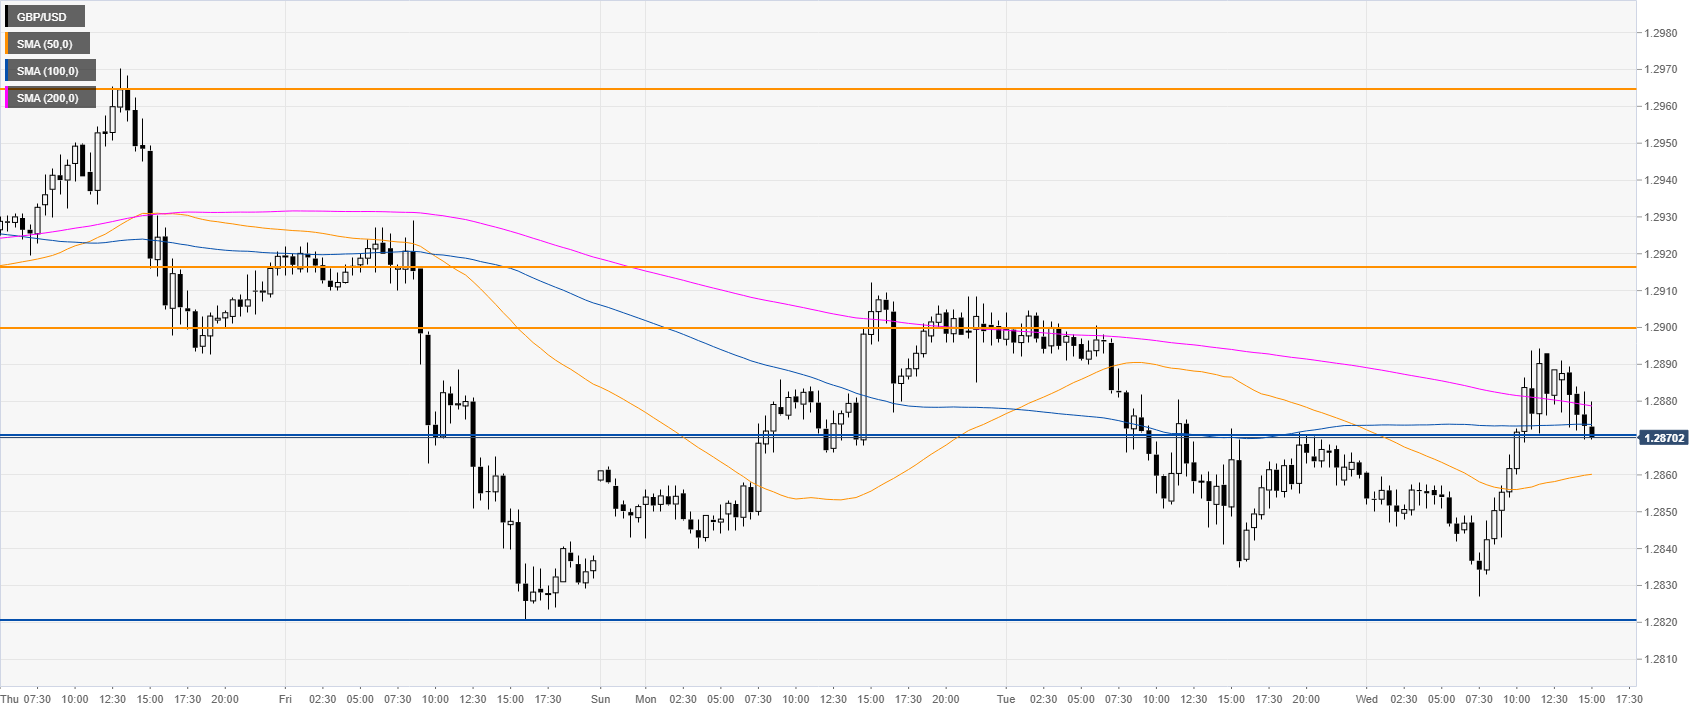
GBP/USD 30-minute chart
Sterling is trading below a downward sloping 200 SMA, suggesting a bearish bias in the short term. Resistance is expected at the 1.2900/1.2910 price zone, according to the Technical Confluences Indicator.
Additional key levels
