- The yellow metal is under bearish pressure as theNew York session comes to an end.
- The outlook remains negative in the medium term.
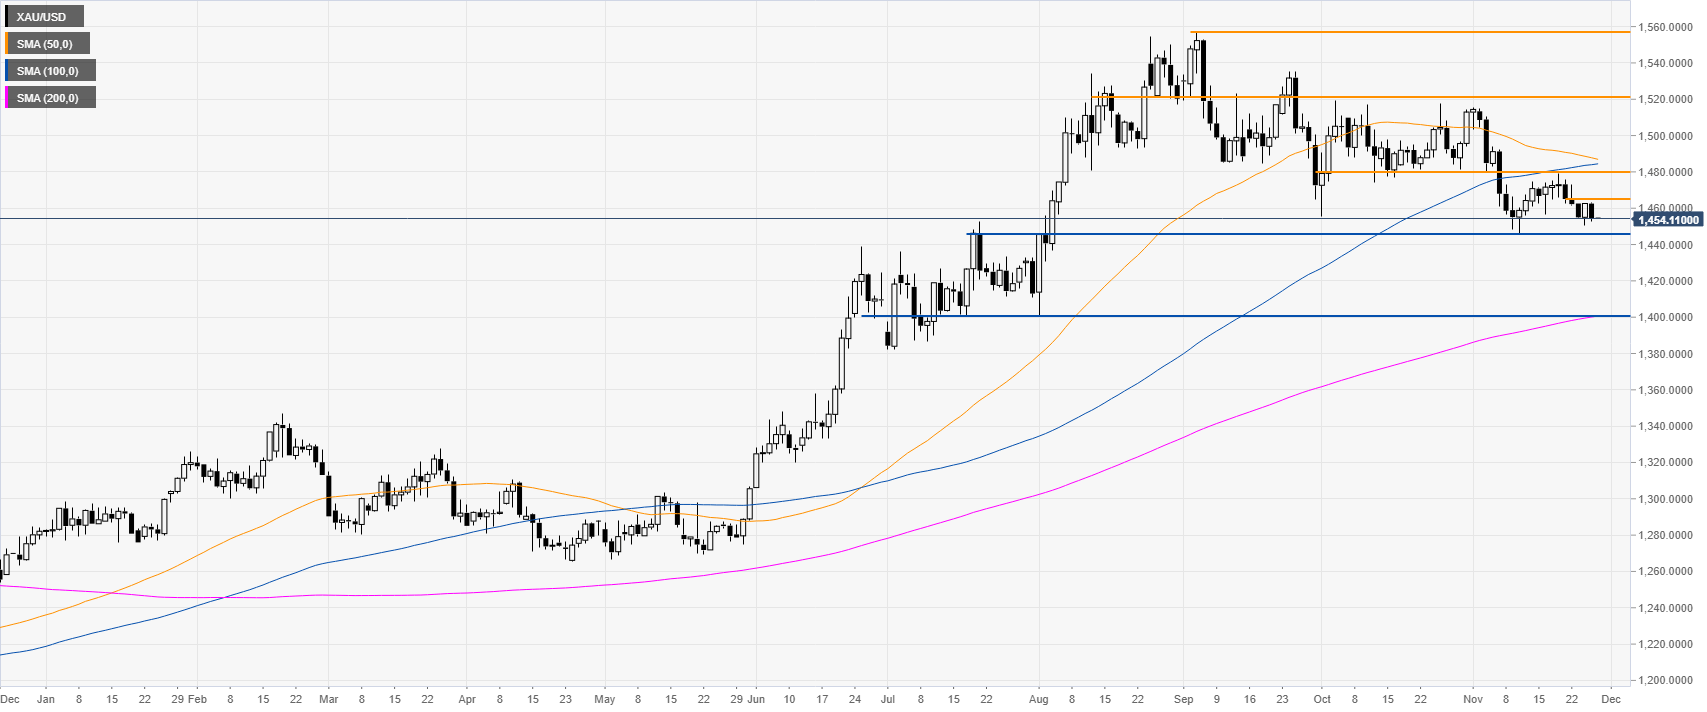
Gold daily chart
Gold is trading below the 50 and 100 SMAs on the daily chart while nearing the 1445 swing low. A break below this level could send the market down near the 1400 handle. Earlier in the New York session, the GDP expanded 2.1% in Q3 (second estimate) vs. 1.9% expected, weighing on XAU/USD.
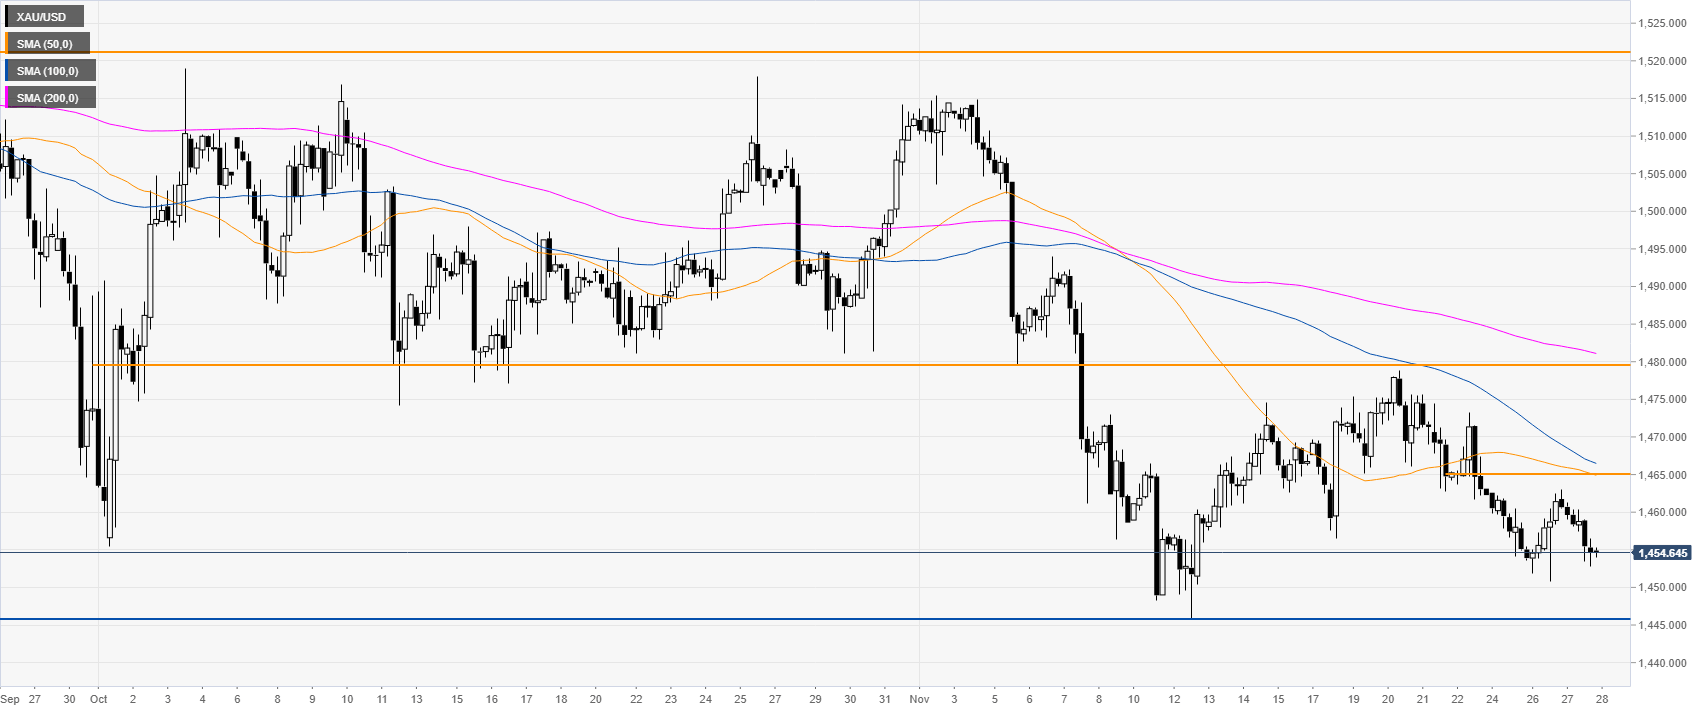
Gold four-hour chart
The market remains under pressure while drifting below the main SMAs. As the metal remains weak, the 1445 level is likely on the bears’ radar in the medium term. Immediate resistance can be located at the 1465 and 1480 levels.
Additional key levels
