- DXY is hovering below the 98.50 key resistance near the November highs.
- The level to beat for bulls is the 98.50 price level.
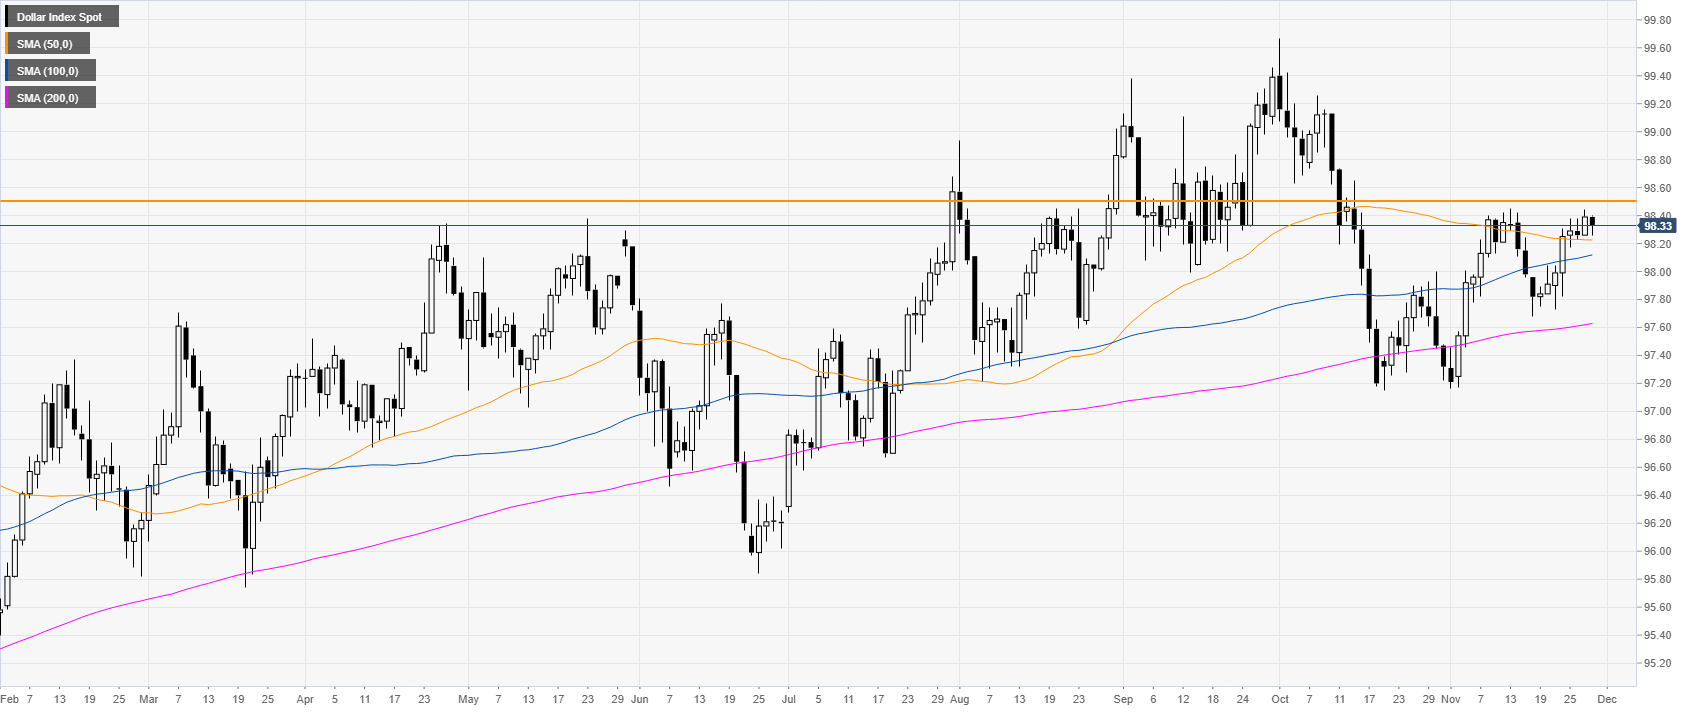
DXY daily chart
DXY (US Dollar Index) is trading in an uptrend above the main daily simple moving averages (DMAs). This Thursday, DXY turns slightly negative, however still hanging near the November highs.
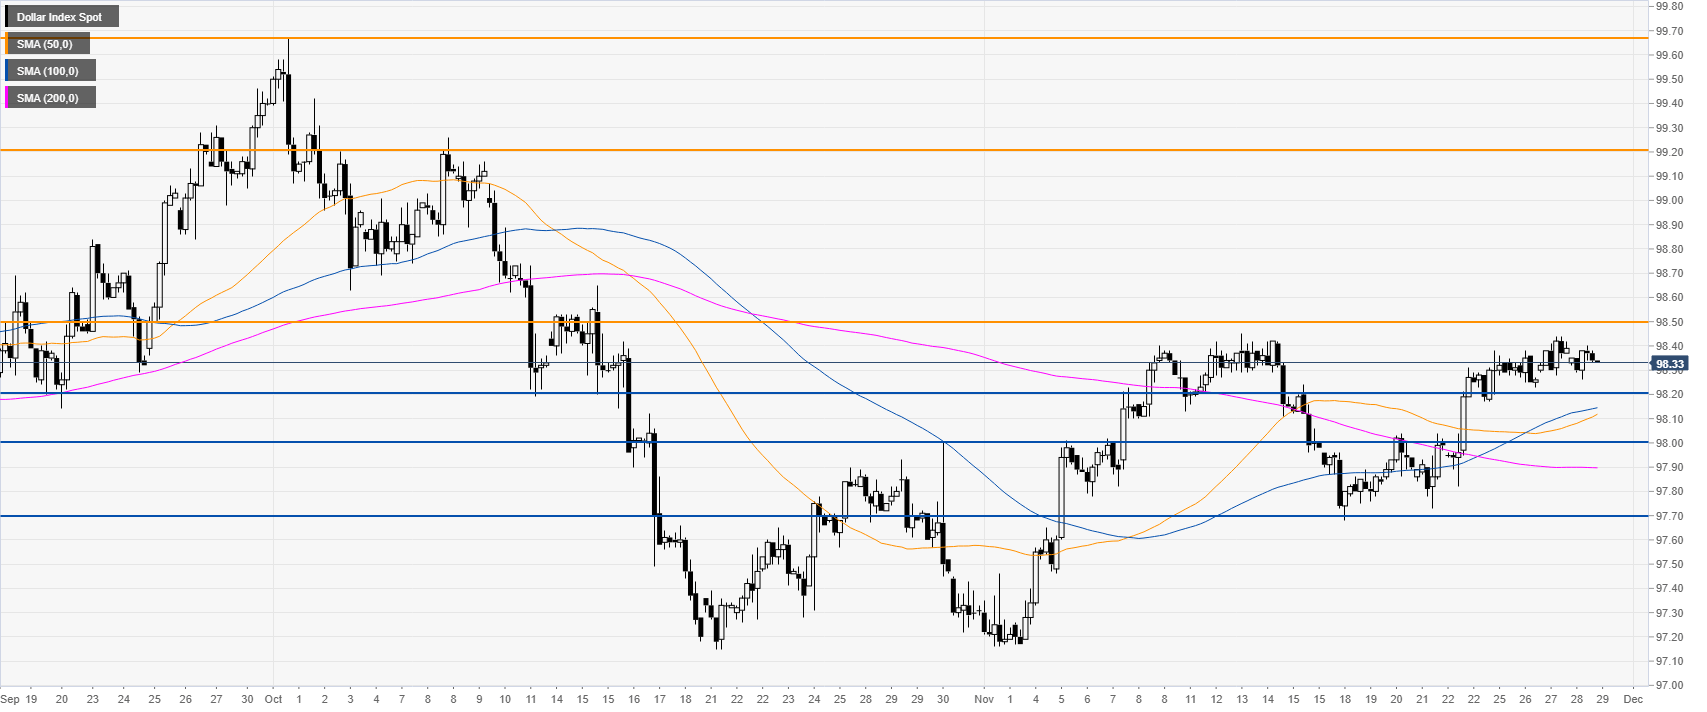
DXY four-hour chart
DXY is trending up above the main SMAs on the four-hour chart. The market is nearing a critical resistance at the 98.50 level just above the November high. A break of the 98.50 level, could expose the 99.20 level and the 99.67 level (2019 high) if the bulls gather enough strength.
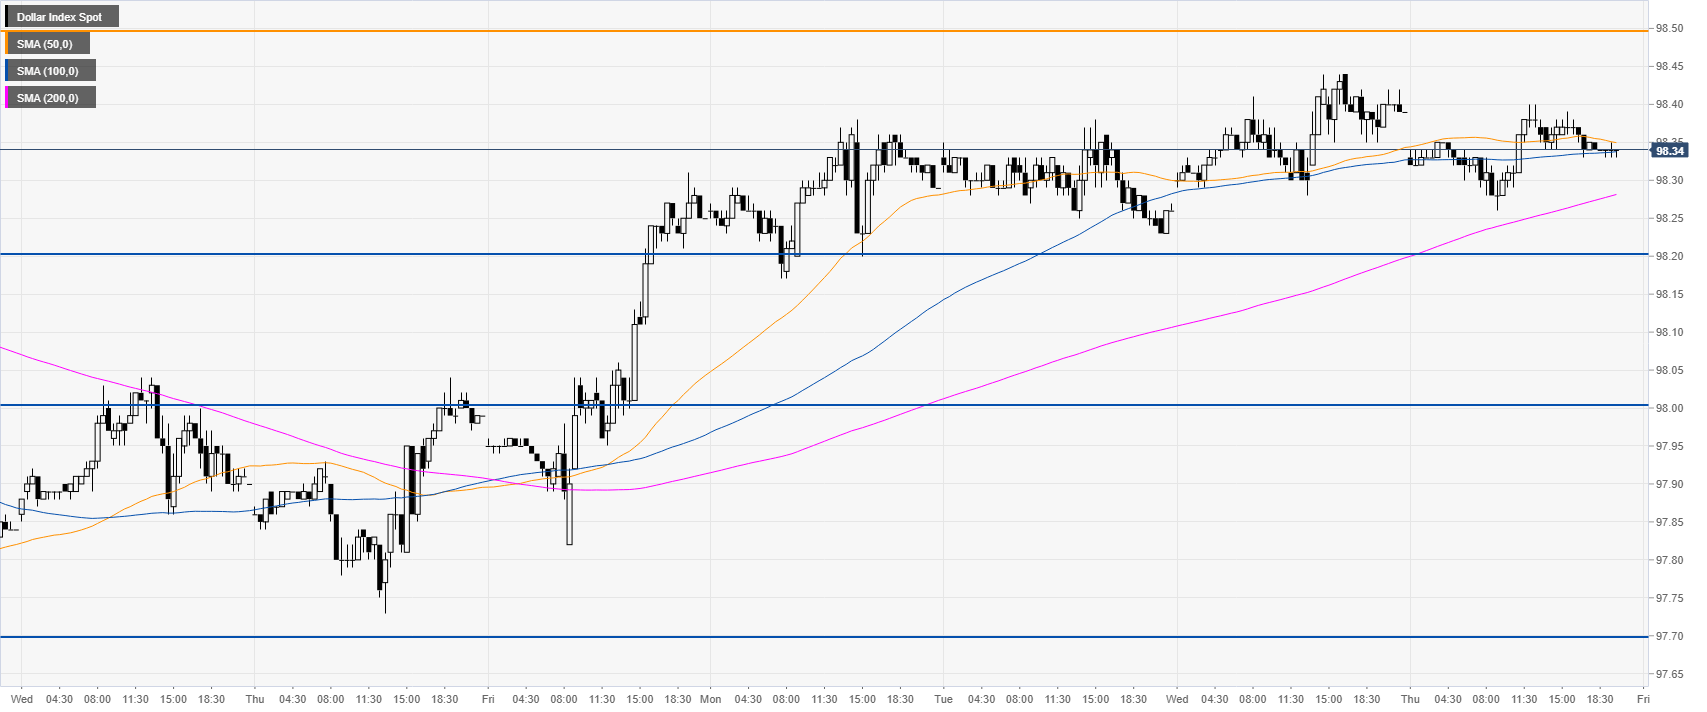
DXY 30-minute chart
The greenback is grinding up above an upward sloping 200 SMA, suggesting bullish momentum in the near term. Support is seen at the 98.20 level and 98.00 handle.
Additional key levels
