- USD/IDR takes another U-turn from near-term key resistance.
- 50-day EMA can provide immediate rest ahead of the adjacent support line.
- Bullish MACD signals keep the buyers hopeful.
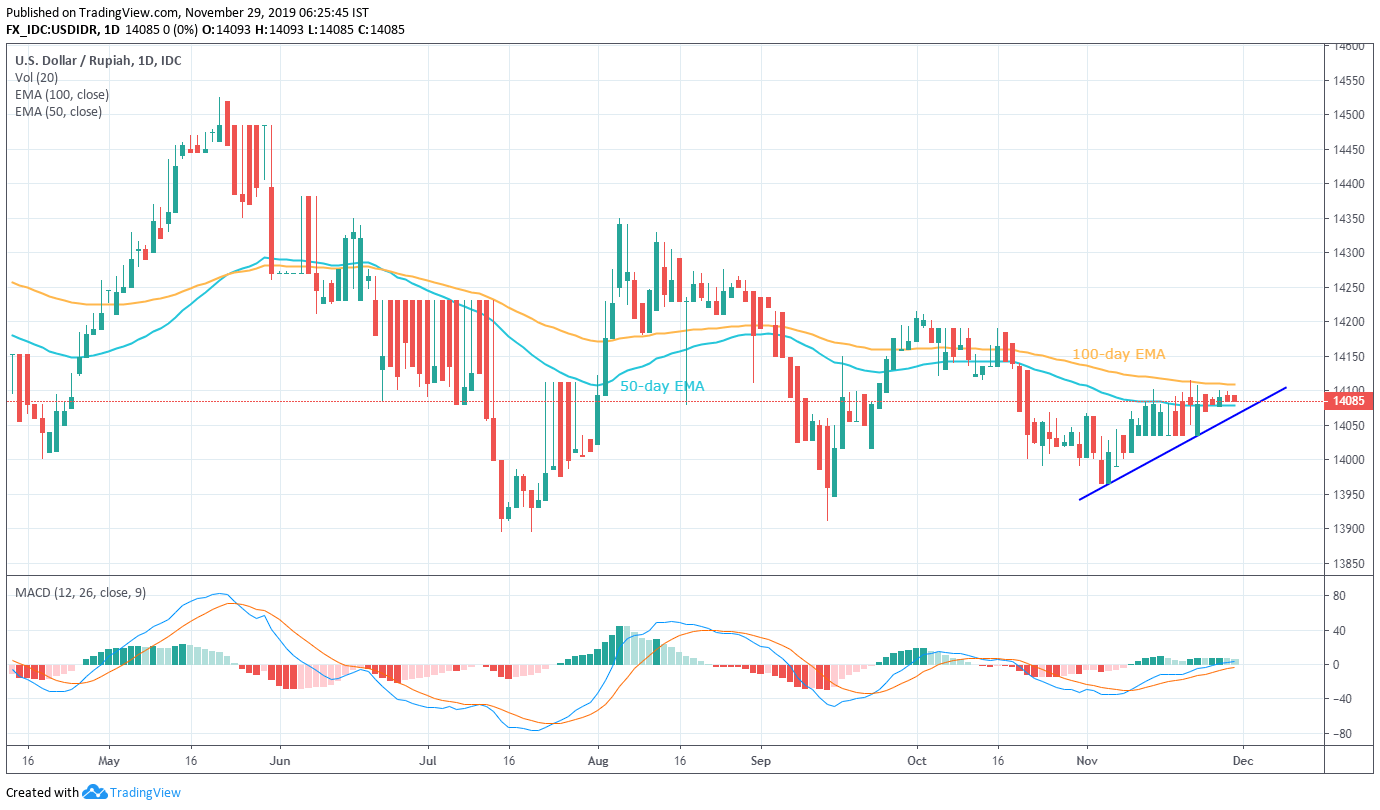
USD/IDR extends pullback from 100-day Exponential Moving Average (EMA) as it traders near 14,085 amid initial Friday trading.
The pair has been trading below the 100-day EMA since late-October while a three-week-old rising trend-line seems to limit the quote’s near-term declines off-late.
Increasing the odds of the pair’s upside are bullish signals from 12-bar Moving Average Convergence and Divergence (MACD). In doing so, the pair needs to provide a clear break of 100-day EMA level of 14,110, which in turn will trigger fresh run-up to October 16 high near 14,190.
Meanwhile, pair’s declines below 50-day EMA level of 14,079 will again highlight the short-term support line, currently at 14,065.
Should there be additional weakness past-14,065, pair’s gradual declines to the monthly low near 13,965 can be expected.
USD/IDR daily chart
Trend: Sideways
