- GBP/USD slips below 61.8% Fibonacci retracement of late-October to early-November fall.
- A short-term symmetrical triangle seems to limit the pair’s immediate moves.
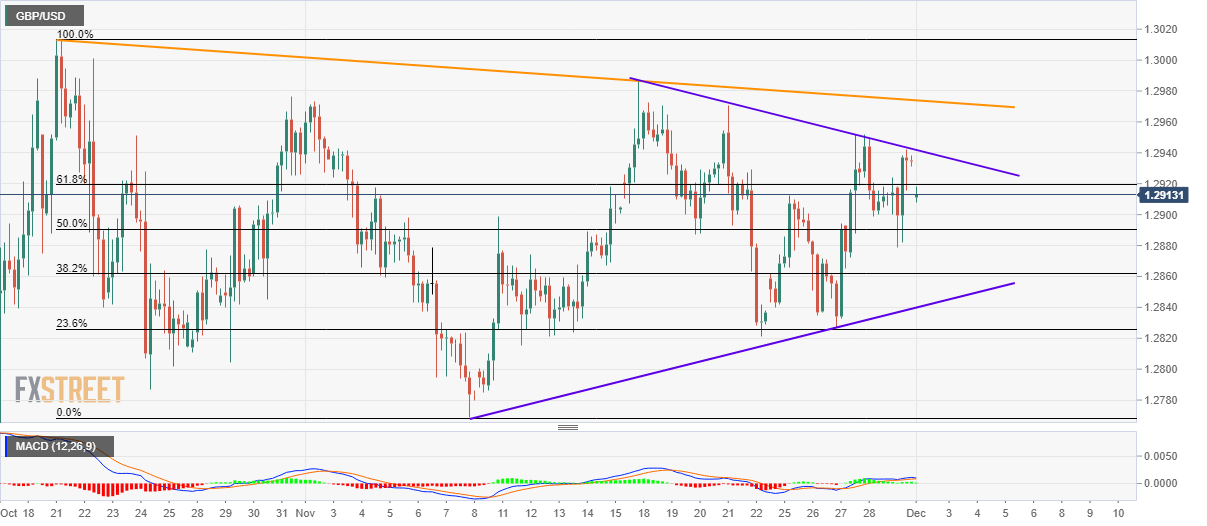
- Bullish MACD keeps buyers hopeful while failures to cross adjacent resistance line, pair’s slip below key Fibonacci retracement, lures sellers.
Following its multiple pullbacks from the two-week-old falling resistance line, GBP/USD declines to 1.2910 by the press time of early Asian session on Monday.
Given the pair’s recent dip below 61.8% Fibonacci retracement, Friday’s low near 1.2880 and an upward sloping trend line since November 08, at 1.2840 now, grab seller’s attention. Though, multiple rest-points around 1.2820 and 1.2800 could challenge bears afterward.
Bullish signals from 12-bar Moving Average Convergence and Divergence (MACD) keeps the buyers’ hopeful. In doing so, the immediate key Fibonacci retracement, at 1.2920, could question another run-up to the previously mentioned falling trend line, at 1.2942.
In a case where buyers manage to cross 1.2942 resistance line, a descending trend line since October 21, near 1.2975, holds the key to pair’s rise towards 1.3000 and October month high near 1.3015.
GBP/USD 4-hour chart
Trend: Sideways
