- EUR/USD remains on the back foot below 50% Fibonacci retracement.
- 1.1050/55 confluence can challenge the upside break while sellers await a daily closing below 61.8% Fibonacci retracement.
- Bullish Candlestick formation favors the pair’s recovery but MACD says the otherwise.
EUR/USD is under pressure around 1.1020 amid the initial Asian trading session on Monday. The prices portrayed a bullish candlestick formation on the daily (D1) chart on Friday.
With the bullish spinning bottom favoring the pair’s recovery, another attempt to 50% Fibonacci retracement of October month upside, at 1.1030, can be expected. However, 50-day Exponential Moving Average (EMA) and a downward sloping trend line since early-November can limit further advances around 1.1050/55.
Alternatively, sellers may concentrate on the bearish signals from the 12-bar Moving Average Convergence and Divergence (MACD) indicator. Though, a daily closing below 61.8% Fibonacci retracement level of 1.0990 becomes necessary to target October 08 low near 1.0940.
In a case where bears dominate below 1.0940, October month low of 1.0880 will be their favorite. On the contrary, late-November high near 1.1100 will be on the bull’s radar beyond 1.1055.
EUR/USD daily chart
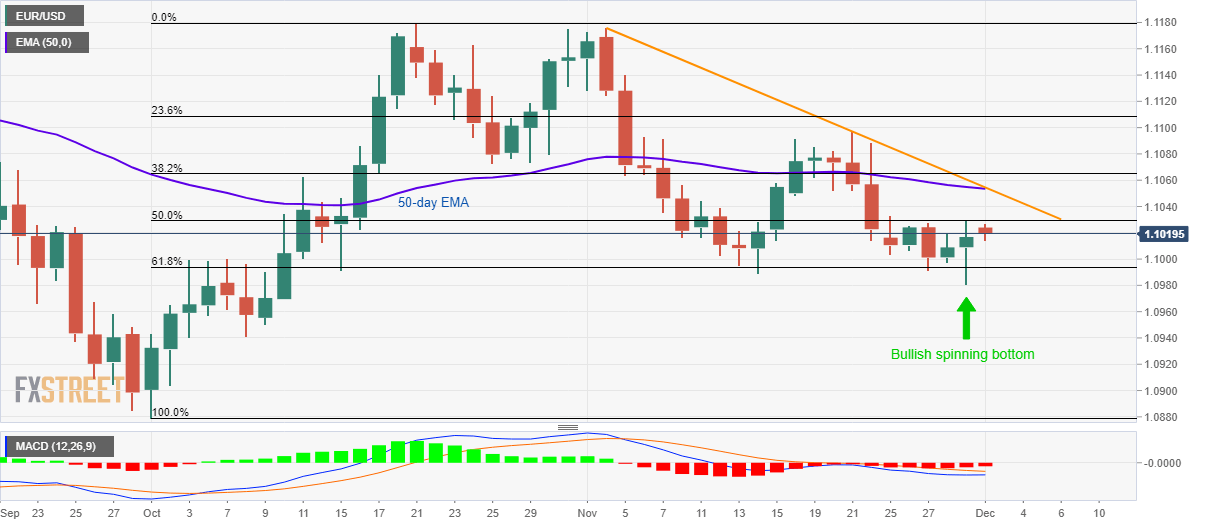
Trend: Recovery expected
