- WTI again bounces off 61.8% Fibonacci retracement of August-September upside.
- Bearish MACD, key Exponential Moving Averages (EMAs) doubt the recent recovery.
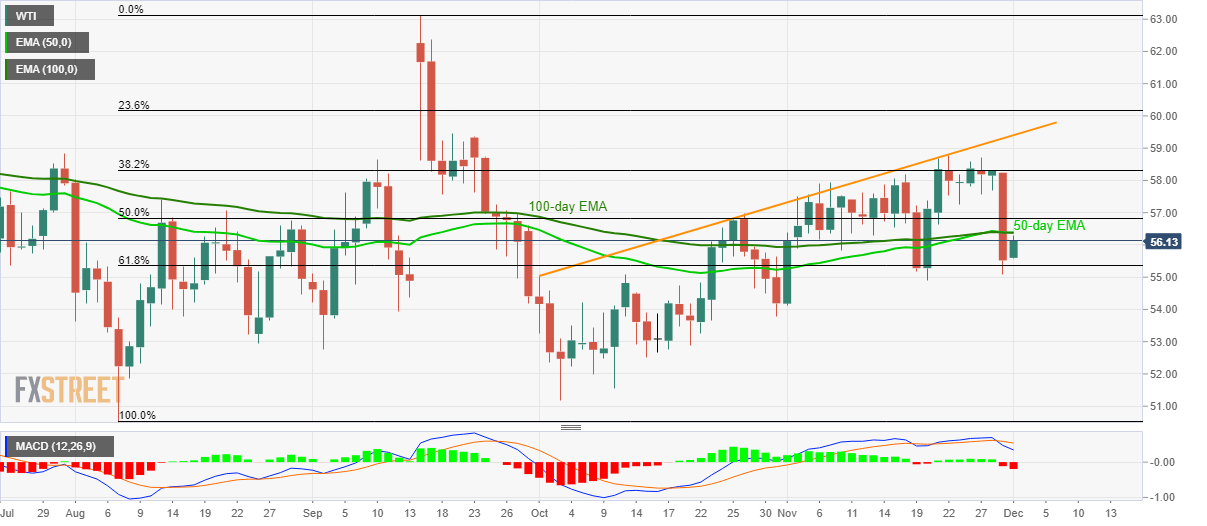
WTI’s recent pullback from 61.8% Fibonacci retracement helps it mark 1.1% gains while taking the bids to $56.15 by the press time of early Monday.
The energy benchmark presently confronts a join of 50 and 100-day EMA, which together with bearish signals from 12-bar Moving Average Convergence and Divergence (MACD) can trigger the quote’s another attempt to declines below the key Fibonacci retracement level of $55.35.
If prices manage to slip beneath $55.35, October-end low near $53.80 will be on the sellers’ radar.
On the upside, a sustained run-up beyond the confluence of 50 and 100-day EMAs, around $56.40, can escalate the rise to $57.50/55 and November 22 high close to $58.80.
Assuming the black gold’s north-run beyond $58.80, an upward sloping trend line since the October-start, at $59.40, will be on the buyers’ radar.
WTI daily chart
Trend: Pullback expected
