- The aussie is trading at session’s highs as the London session is coming to an end.
- The level to beat for bulls is the 0.6825/40 resistance zone.
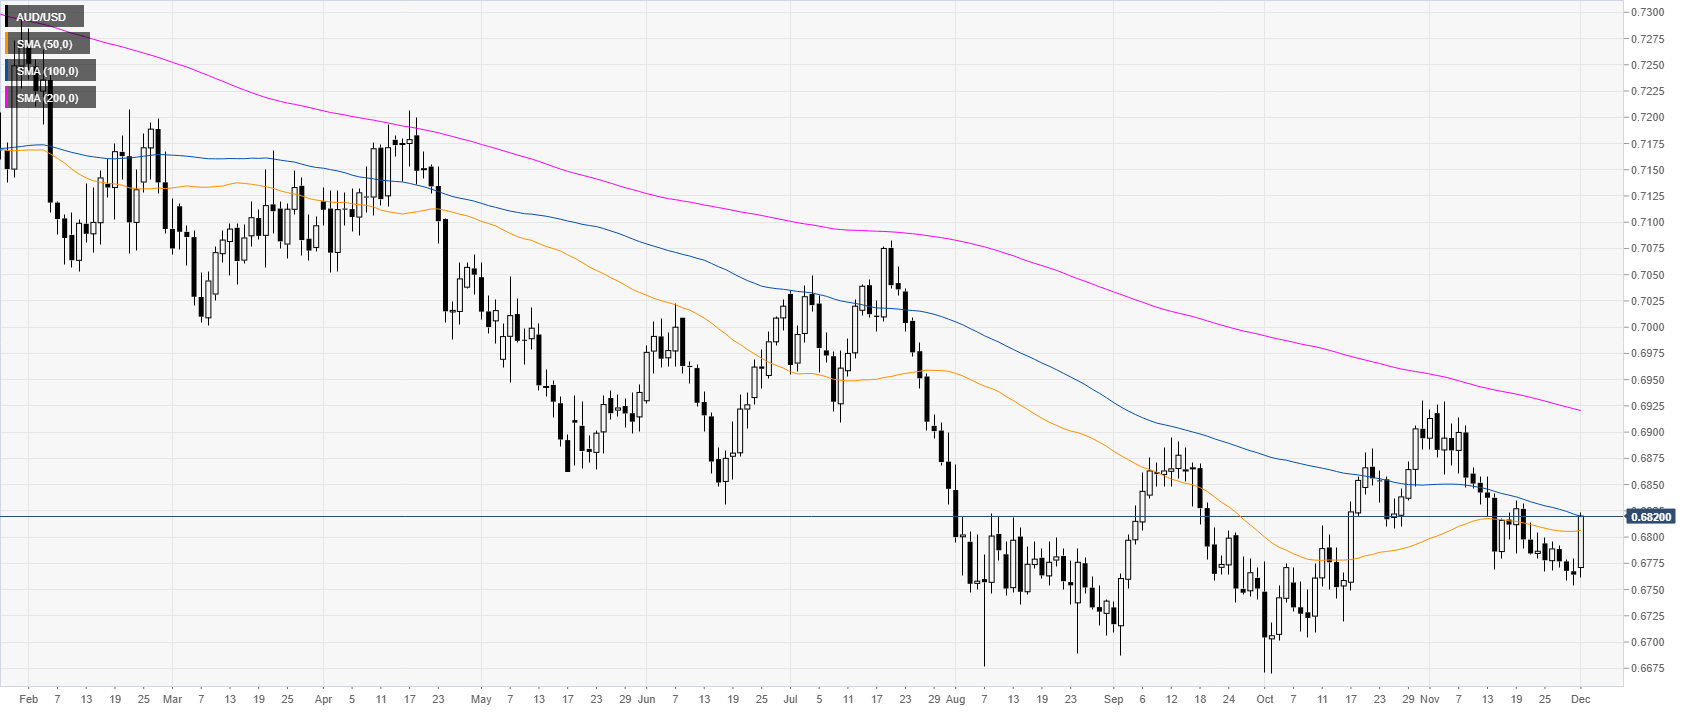
AUD/USD daily chart
AUD/USD is trading in a bear trend below the 200-day simple moving average (DMA). However, the spot is having a sharp reversal up blasting above the 0.6800 handle and challenging the 100 DMA.
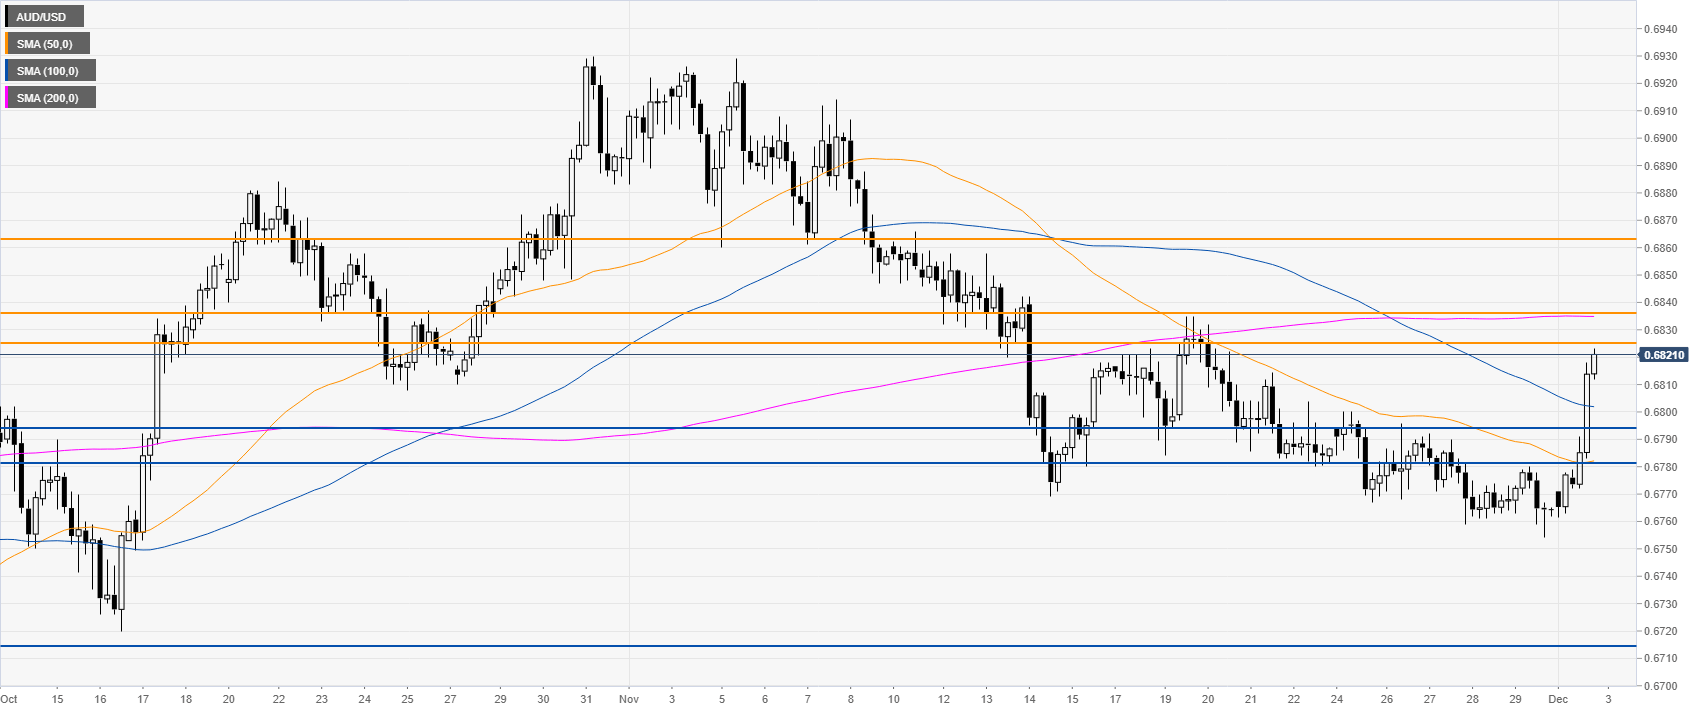
AUD/USD four-hour chart
The aussie is starting December with a bullish breakout. The market is now approaching the 0.6825/40 resistance zone near the 200 SMA. If the bulls gather enough strength and break above it, the spot is set to continue its ascent towards the 0.6825 price level, according to the Technical Confluences Indicator.
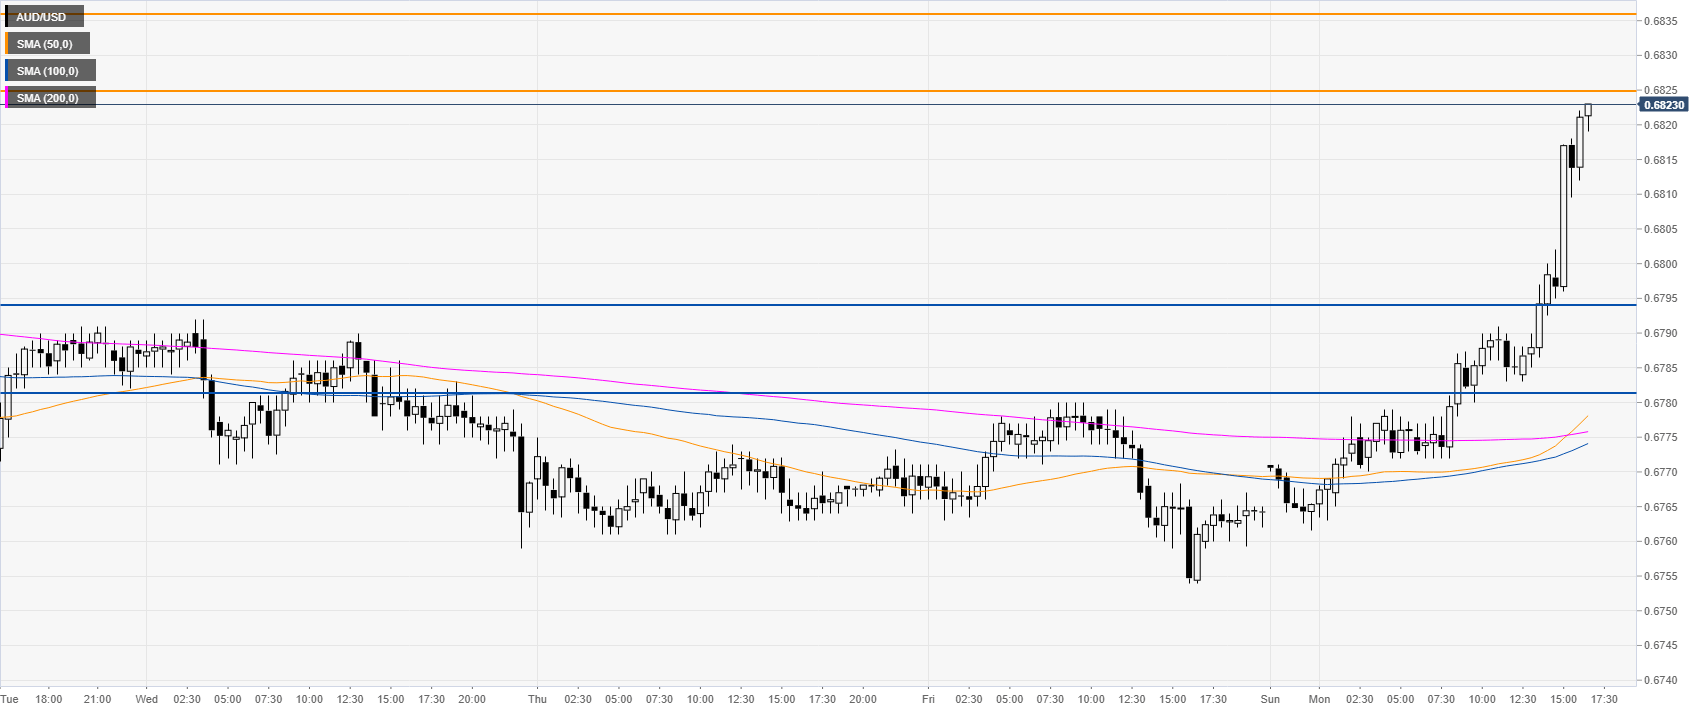
AUD/USD 30-minute chart
AUD/USD is spiking up above the main SMA, suggesting strong bullish momentum. Support can be seen at the 0.6796 and 0.6780 price levels, according to the Technical Confluences Indicator.
Additional key levels
