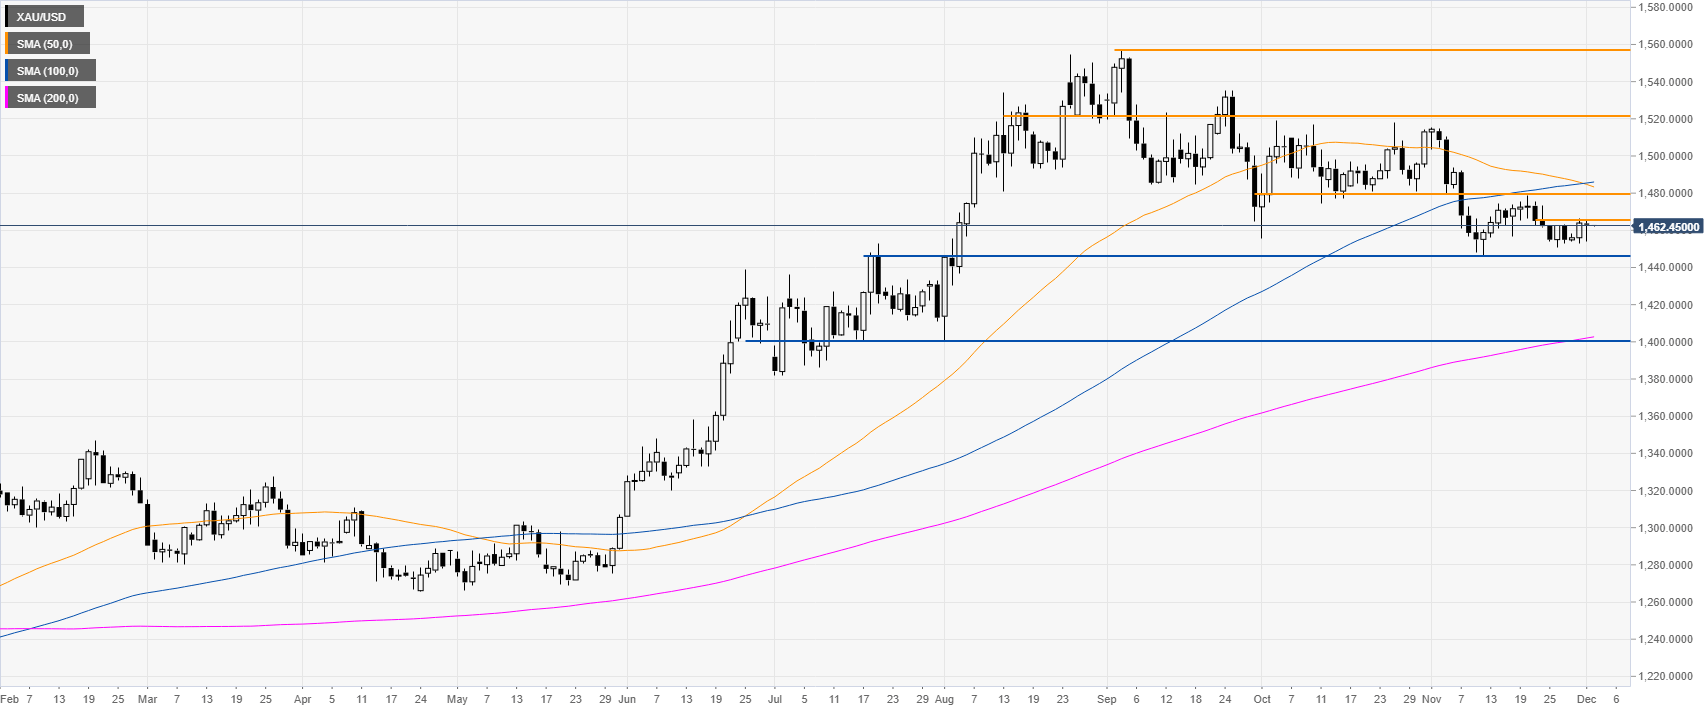
- The yellow metal is starting December trapped in familiar ranges.
- The key resistance to watch is the 1465 level.
Gold daily chart
Gold is starting the last month of 2019, questioning the 1465 resistance level while trading below the 50/100-day simple moving averages (SMAs). However, the market would likely become strongly bearish below 1445 swing low on a daily closing basis as it could entail a dive to the 1400 figure near the 200-day SMA.
Gold four-hour chart
The metal is putting the 50 and 100 SMAs under pressure as the market is trying to break above the 1465 resistance. If the buyers are successful, it can lead to the market to the 1480 level in the medium term.
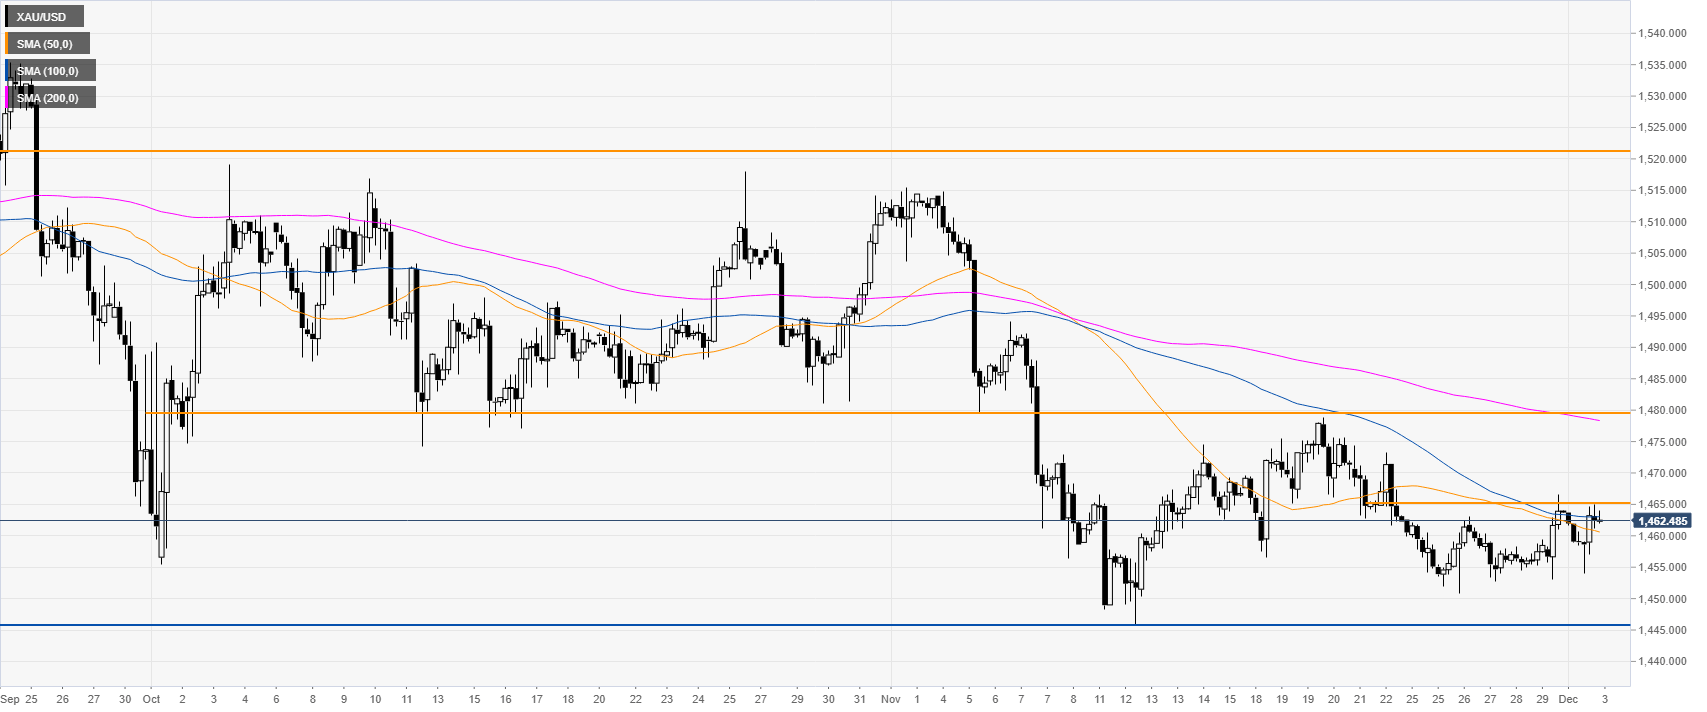
Additional key levels
