- USD/IDR pulls back from the six-week high.
- Sustained trading beyond multi-month-old falling trend line, 100-DMA portrays the pair’s strength.
With its failure to extend the previous run-up to late-October tops, USD/IDR witnessing profit booking towards 14,120 while heading into the European session on Tuesday.
The pair struggles around 50% Fibonacci retracement of July-August upside while it’s successful rise beyond 100-day Simple Moving Average (DMA) and a four-month-old falling trend line favors the buyers.
Also increasing the odds for the pair’s further increase is the bullish histogram of the 12-bar Moving Average Convergence and Divergence (MACD) indicator.
As a result, buyers will keep eyes on 200-DMA level near 14,160 as far as the quote stays above the multi-month old support line, at 14,080.
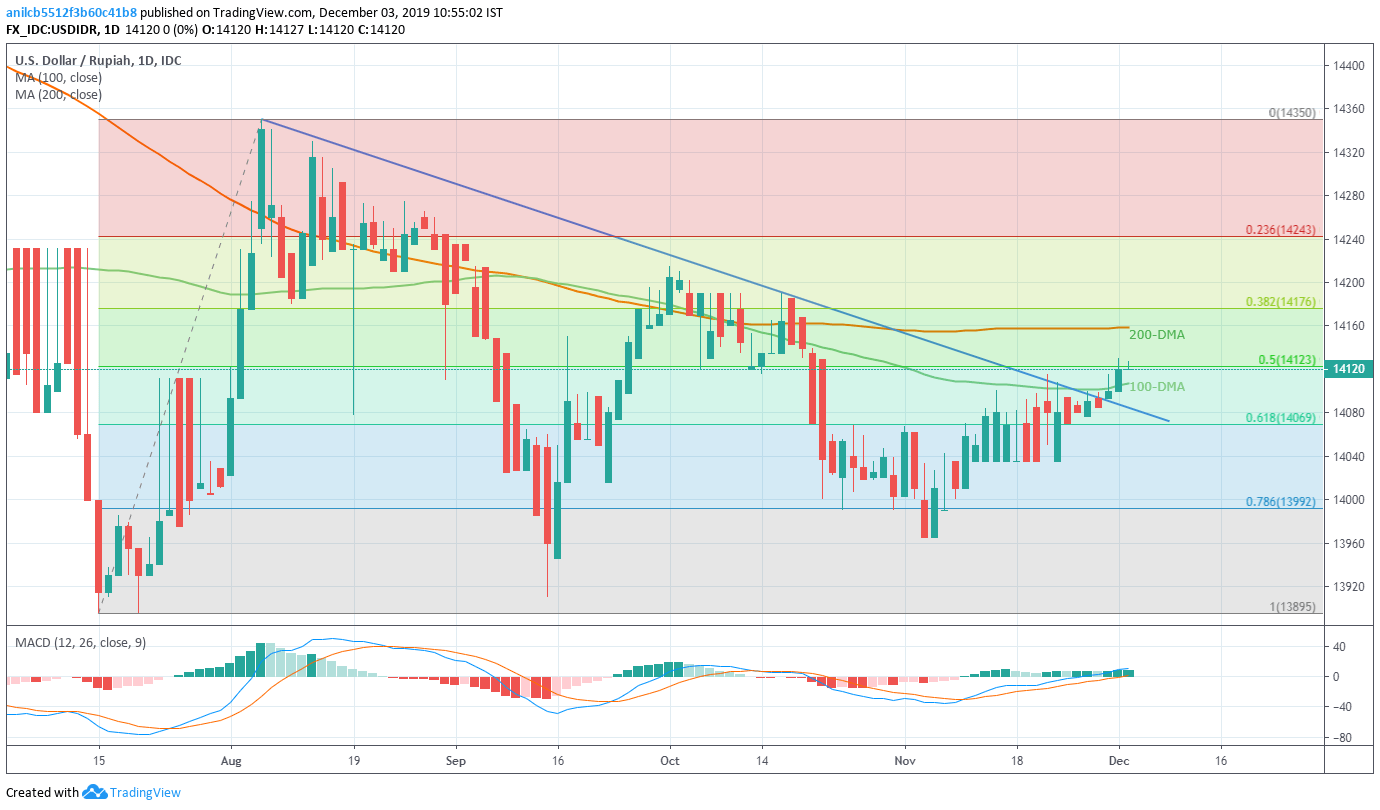
While October month high surrounding 14,215 could entertain buyers past-200-DMA, 61.8% Fibonacci retracement near 14,070 and 14,000 might lure sellers during the fall below 14,080.
USD/IDR daily chart
Trend: Bullish
