- USD/JPY is choppy in the New York session.
- The level to beat for bears is the 108.41 support.
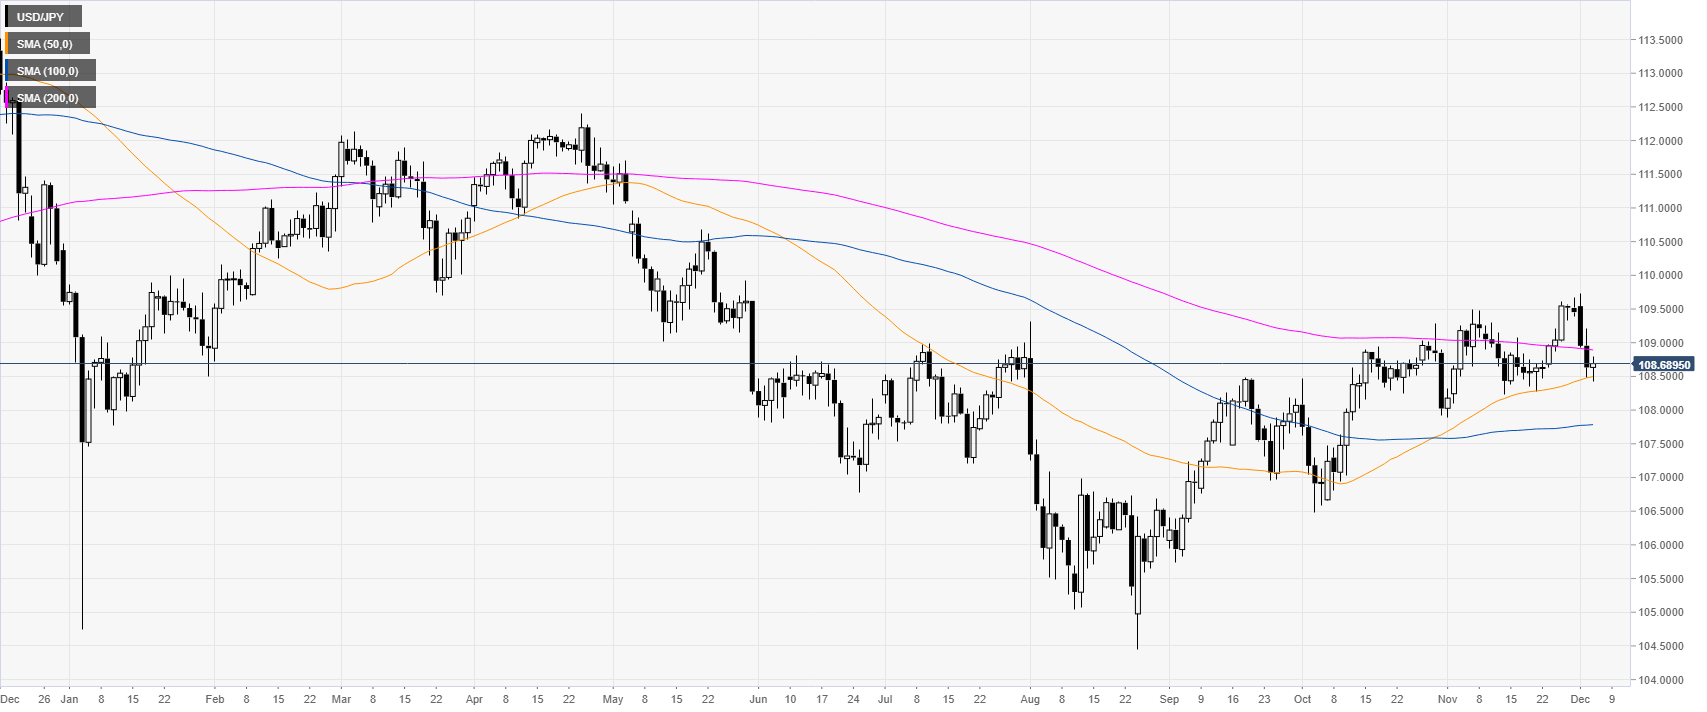
USD/JPY daily chart
USD/JPY is consolidating the recent drop below the 109.00 handle and the 200-day simple moving average (DMA) on the daily chart. The market is finding some support near the 108.50 level and the 50 SMA.
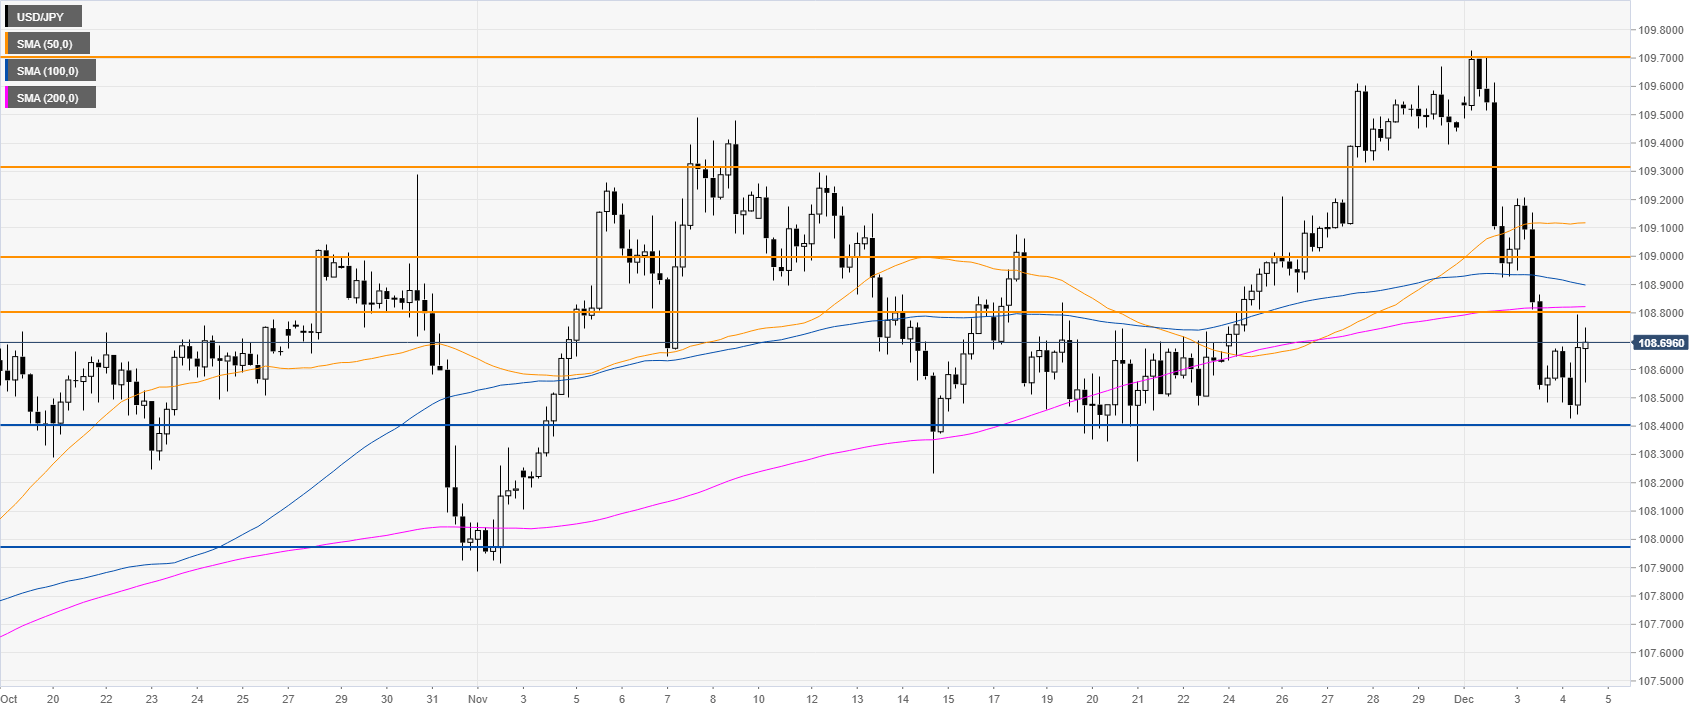
USD/JPY four-hour chart
USD/JPY is consolidating the sharp down move, which dragged the spot below the 109.00 figure and its main SMAs. As the market remains weak, the market could decline towards 108.41 and 107.96 price levels, according to the Technical Confluences Indicator.
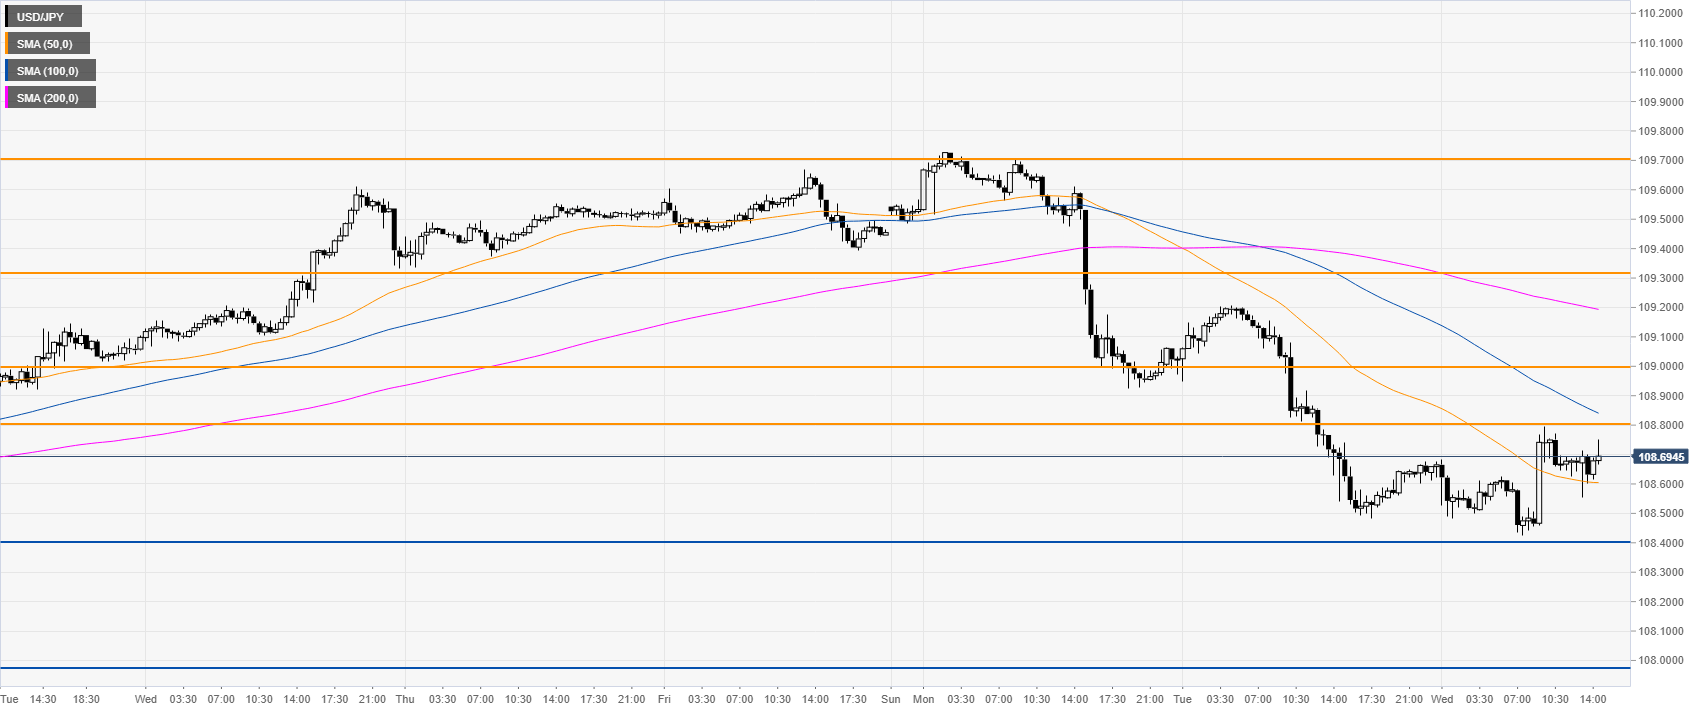
USD/JPY 30-minute chart
USD/JPY is trading below downward sloping 100/200 SMAs on the 30-minute chart suggesting a bearish momentum in the near term. Resistance is seen at 108.80, 109.00 and 109.31 price levels, according to the Technical Confluences Indicator.
Additional key levels
