- GBP/JPY clings to half-yearly resistance line while trading around the highest since May 13.
- Buyers seem to catch a breath after a heavy rush to the north, an upside break could recall March-April lows.
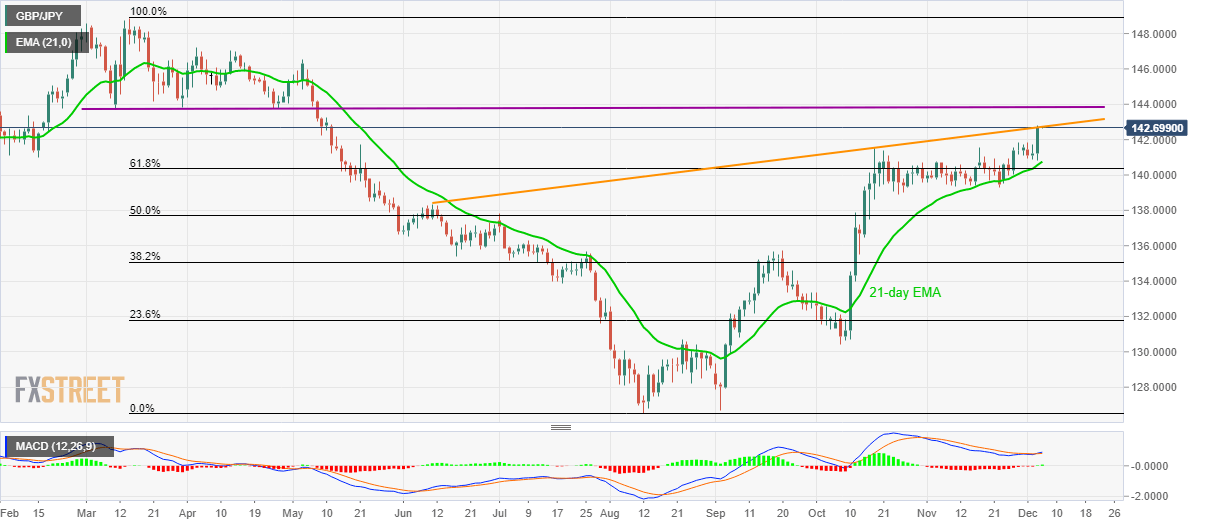
- 21-day EMA, 61.8% Fibonacci retracement act as immediate supports.
Having surged to the highest in nearly seven months, GBP/JPY seesaws around 142.70 during Asian session on Thursday.
The pair clings to a multi-month-old resistance line and requires a sustained break of 142.73/75 to take aim at lows marked in March and April months around 143.72/80.
However, a downside break below November month high close to141.85 can drag the pair back to 21-day Exponential Moving Average (EMA) level of 140.75 and 61.8% Fibonacci retracement of March-August downpour surrounding 140.35.
Given the sellers’ dominance past-140.35, 140.00 round-figure could offer an intermediate halt to the previous month low near 139.30.
GBP/JPY daily chart
Trend: Pullback expected
