- USD/JPY is trading near the December lows below its 200 DMA.
- Support is seen at the 108.45 and 108.11 levels.
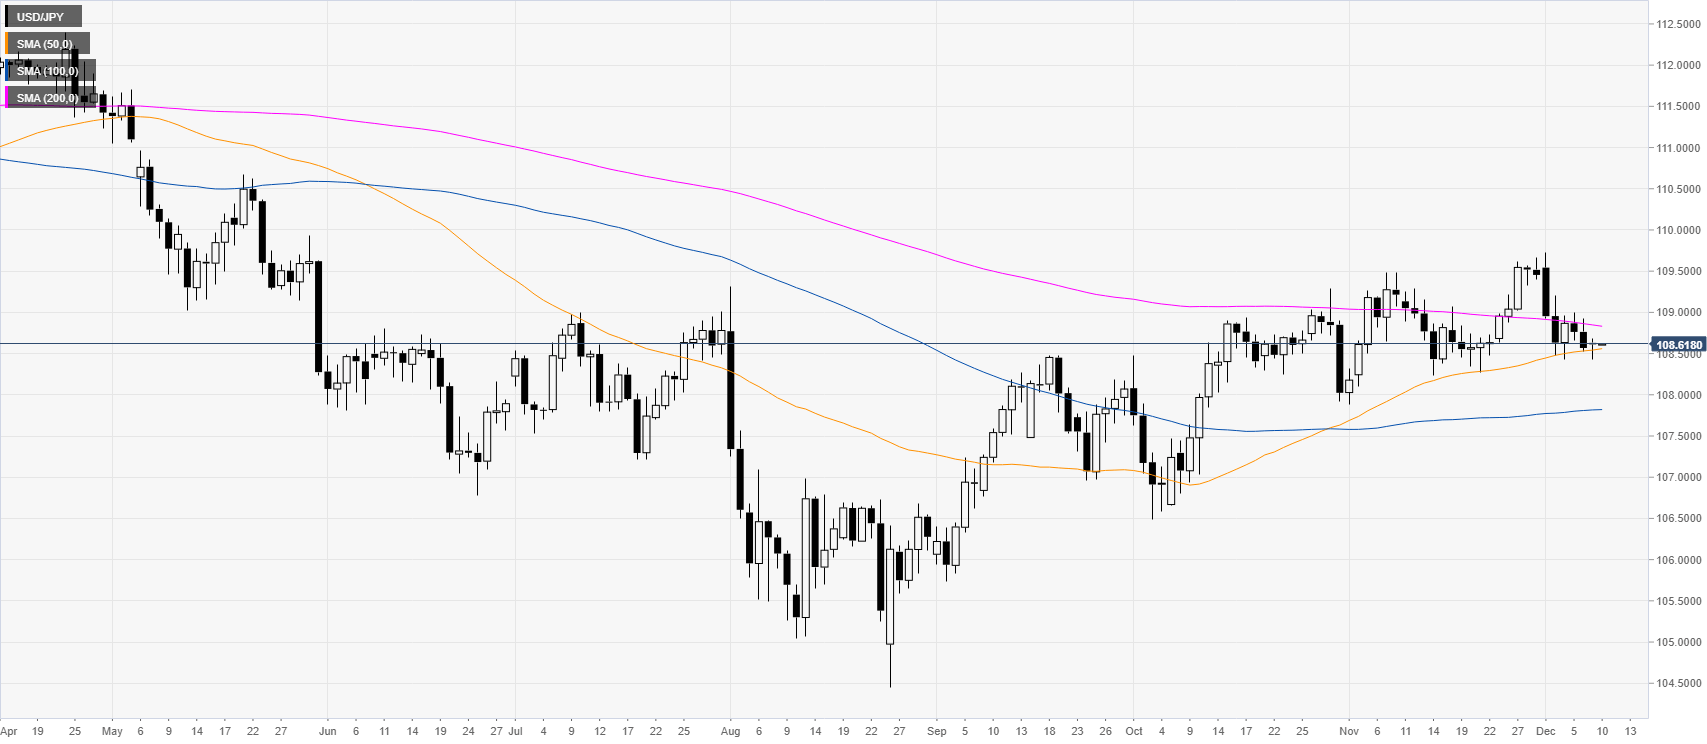
USD/JPY daily chart
USD/JPY is trading near the December lows above the 108.50 level and the 50-day simple moving average (DMA). However, the spot is trading below the 200 DMA, which can be a sign of weakness.
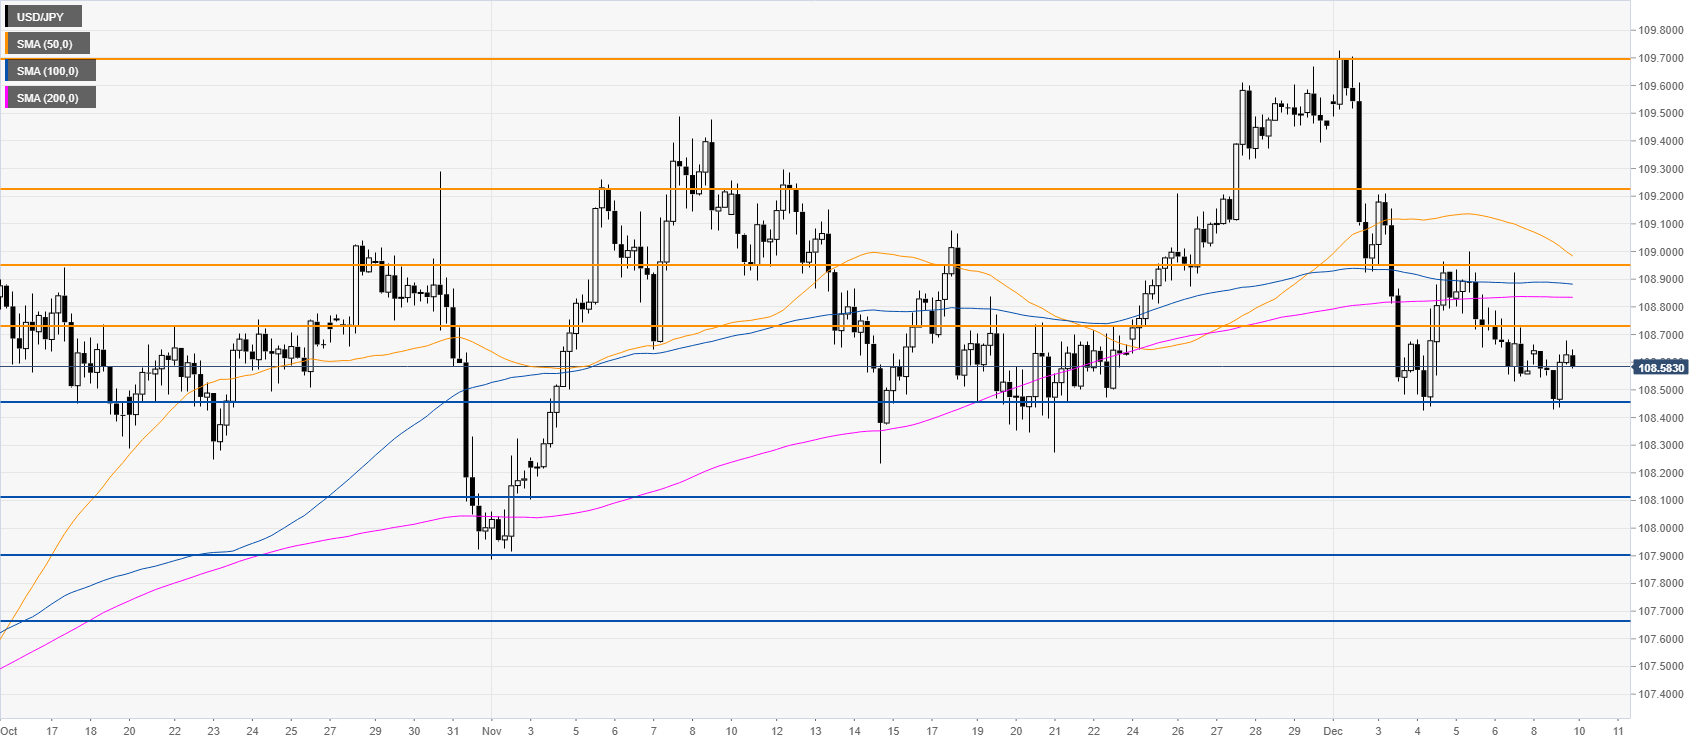
USD/JPY four-hour chart
The market is consolidating the early December drop while below the main SMAs. A daily close below the 108.45 support can see the market decline towards the 108.11, 107.90 and 107.66 price levels.
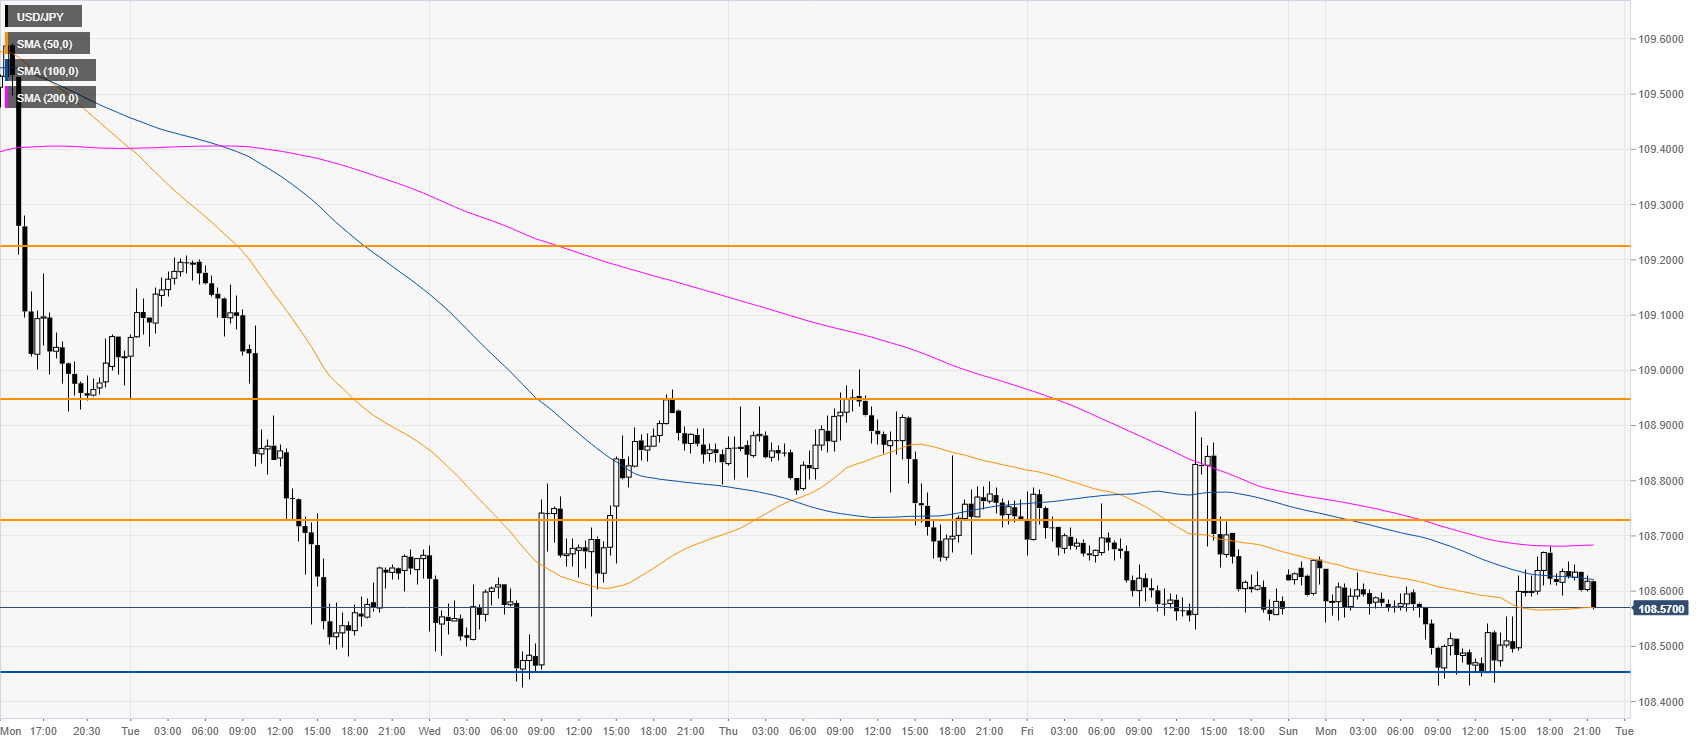
USD/JPY 30-minute chart
The market is trading below downward sloping 100/200 SMA, suggesting a bearish bias in the near term. Resistances are seen near 108.73, 108.95, 109.24 and 109.69 price levels, according to the Technical Confluences Indicator.
Additional key levels
