- GBP/USD buyers remain in control above the 1.3155 level.
- The level to beat for bulls is the 1.3183 resistance.
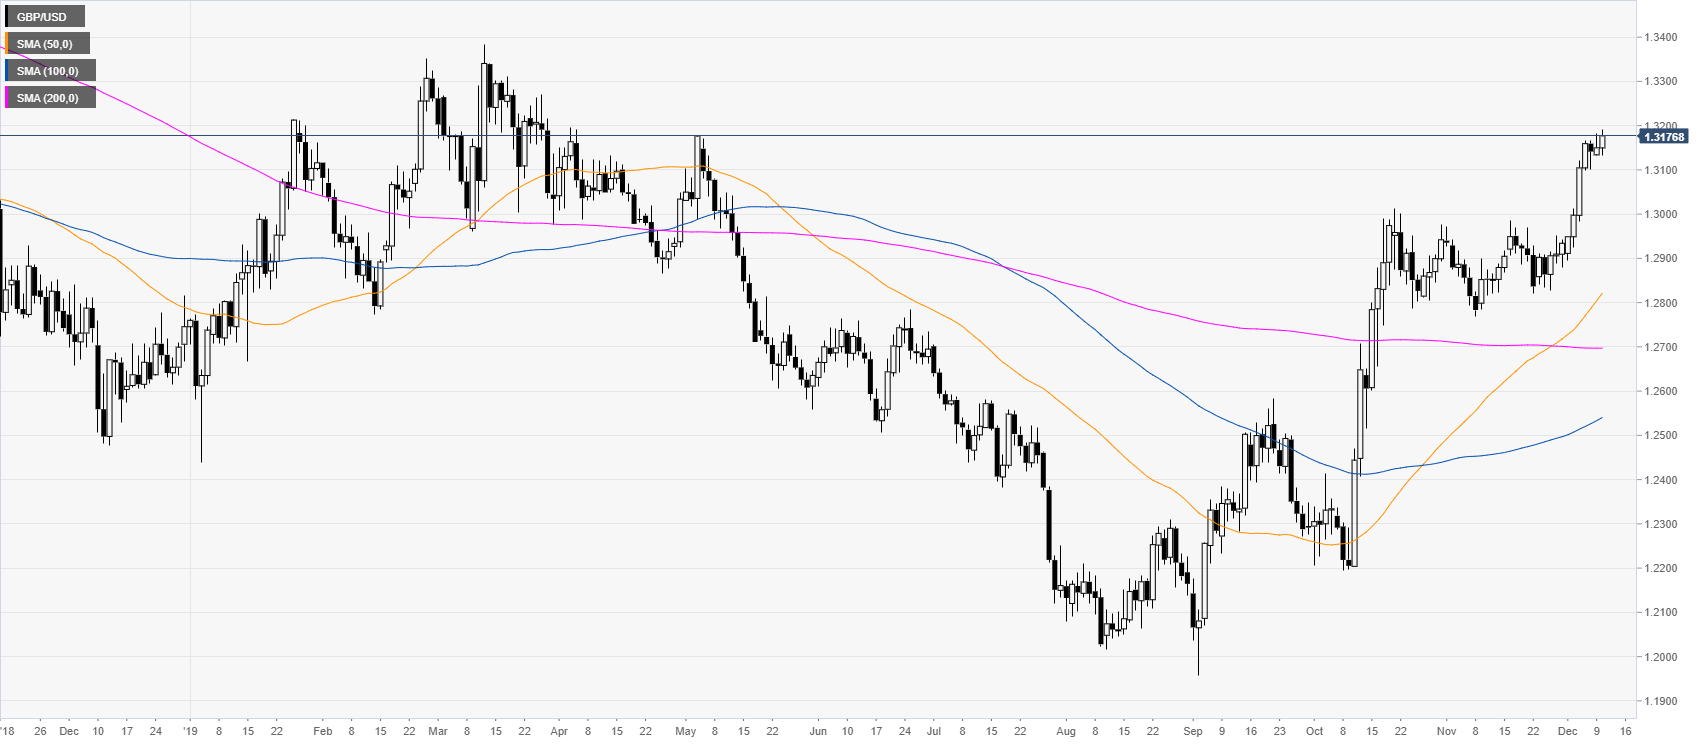
GBP/USD daily chart
The market is pressuring seven-month highs, challenging levels last seen in early May 2019. In the New York session, the market is challenging the session’s highs.
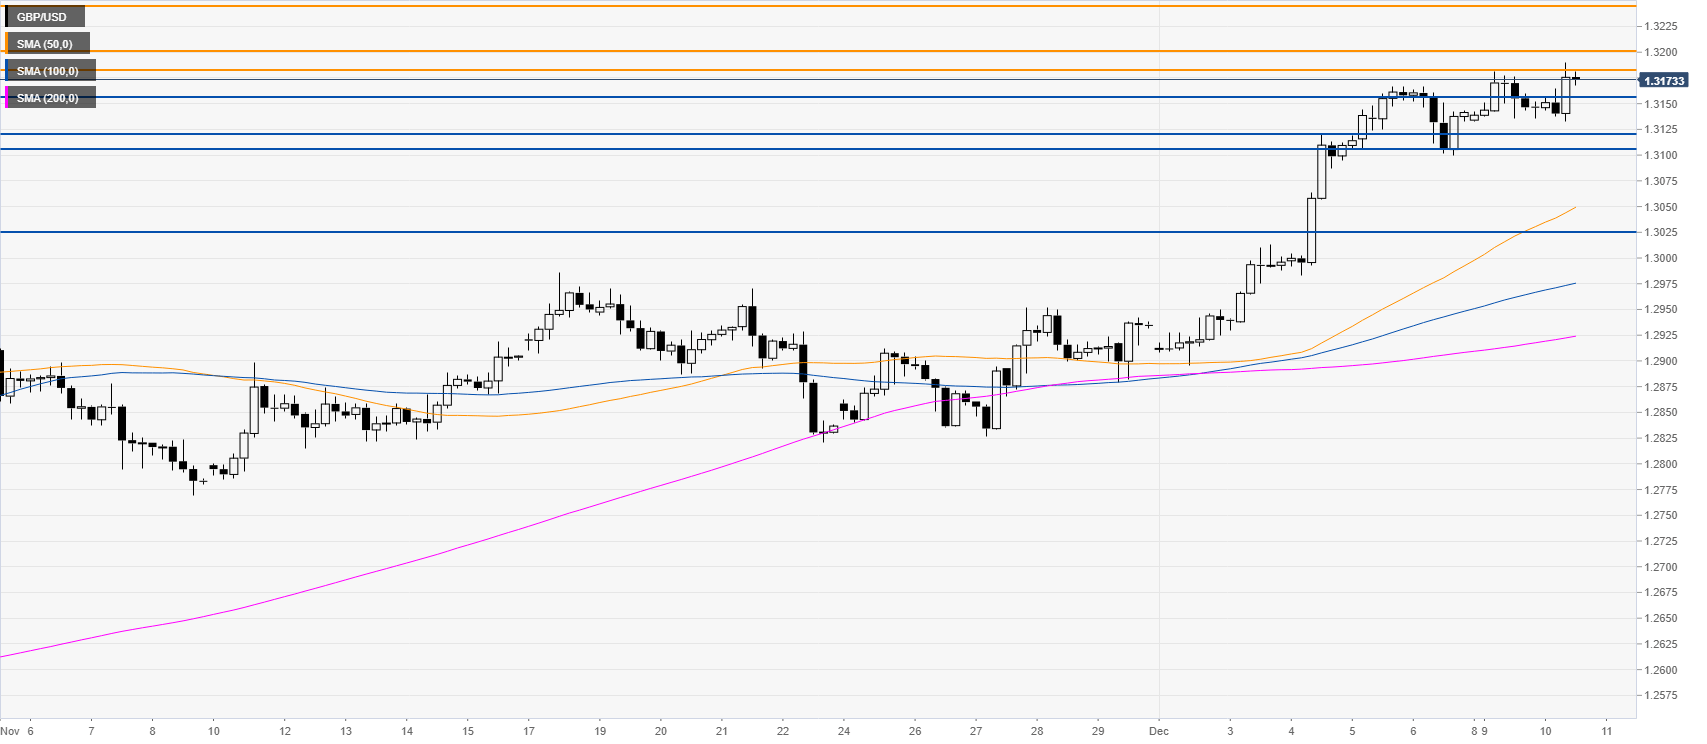
GBP/USD four-hour chart
GBP/USD is advancing above the main SMAs. For the fourth consecutive session, buyers are trying to break beyond the 1.3183 resistance, which would open the doors to further gains towards the 1.3203 and 1.3244 resistances, according to the Technical Confluences Indicator.
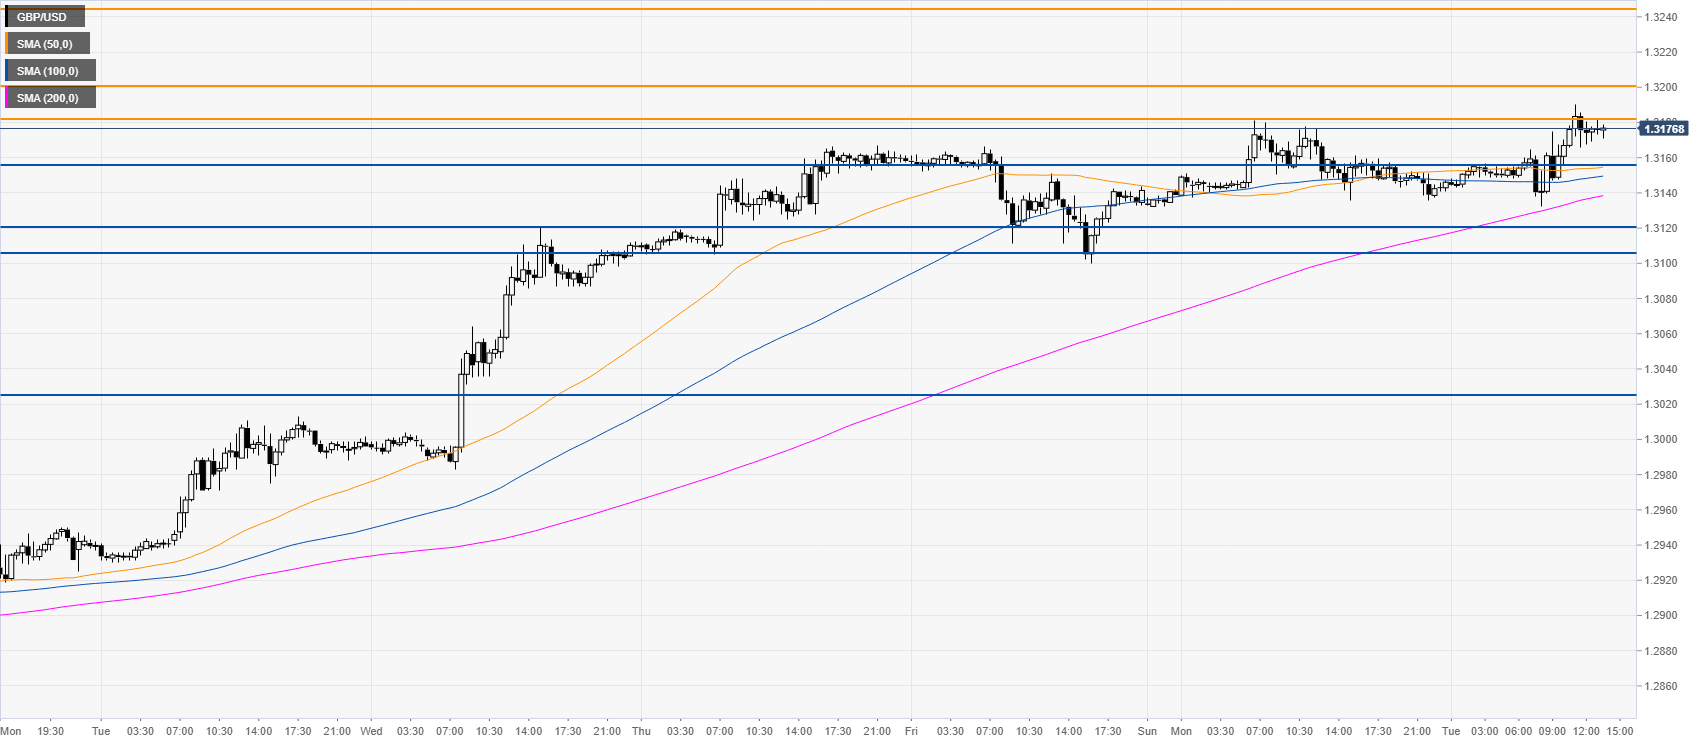
GBP/USD 30-minute chart
The spot is evolving above the main SMAs, confirming the bullish momentum in the short term. Support is seen at the 1.3155 level. However, a daily close below the 1.3121/07 zone could lead to a deeper retracement towards the 1.3025 level.
Additional key levels
