- DXY is weakening below the 97.55 resistance level.
- Support is seen at the 98.35 and 97.15 levels.
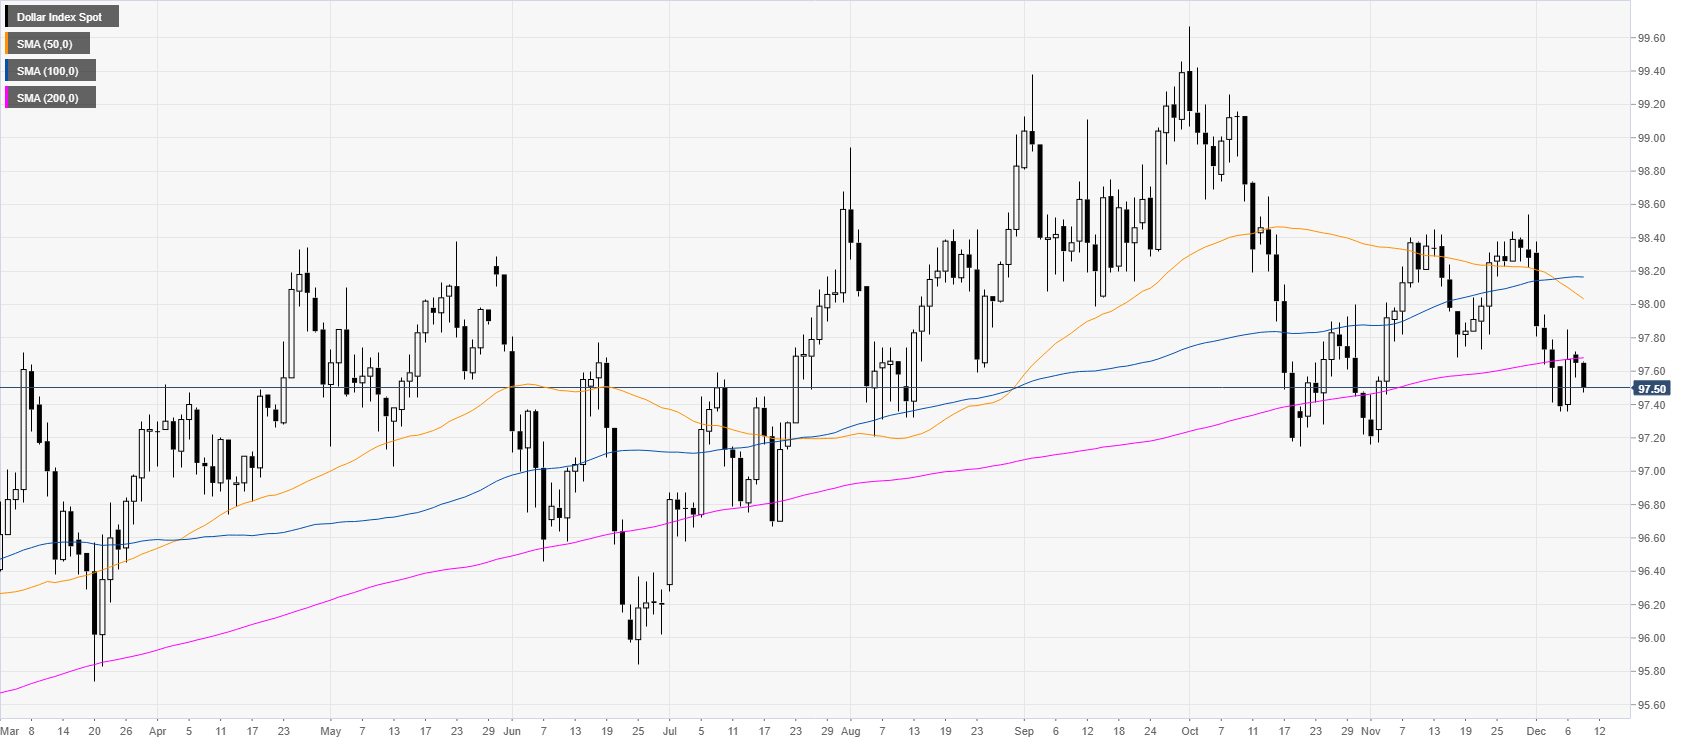
DXY daily chart
DXY (US Dollar Index) is trading in a weak bull trend as the index is under pressure just below the 200-day simple moving average (DMA).
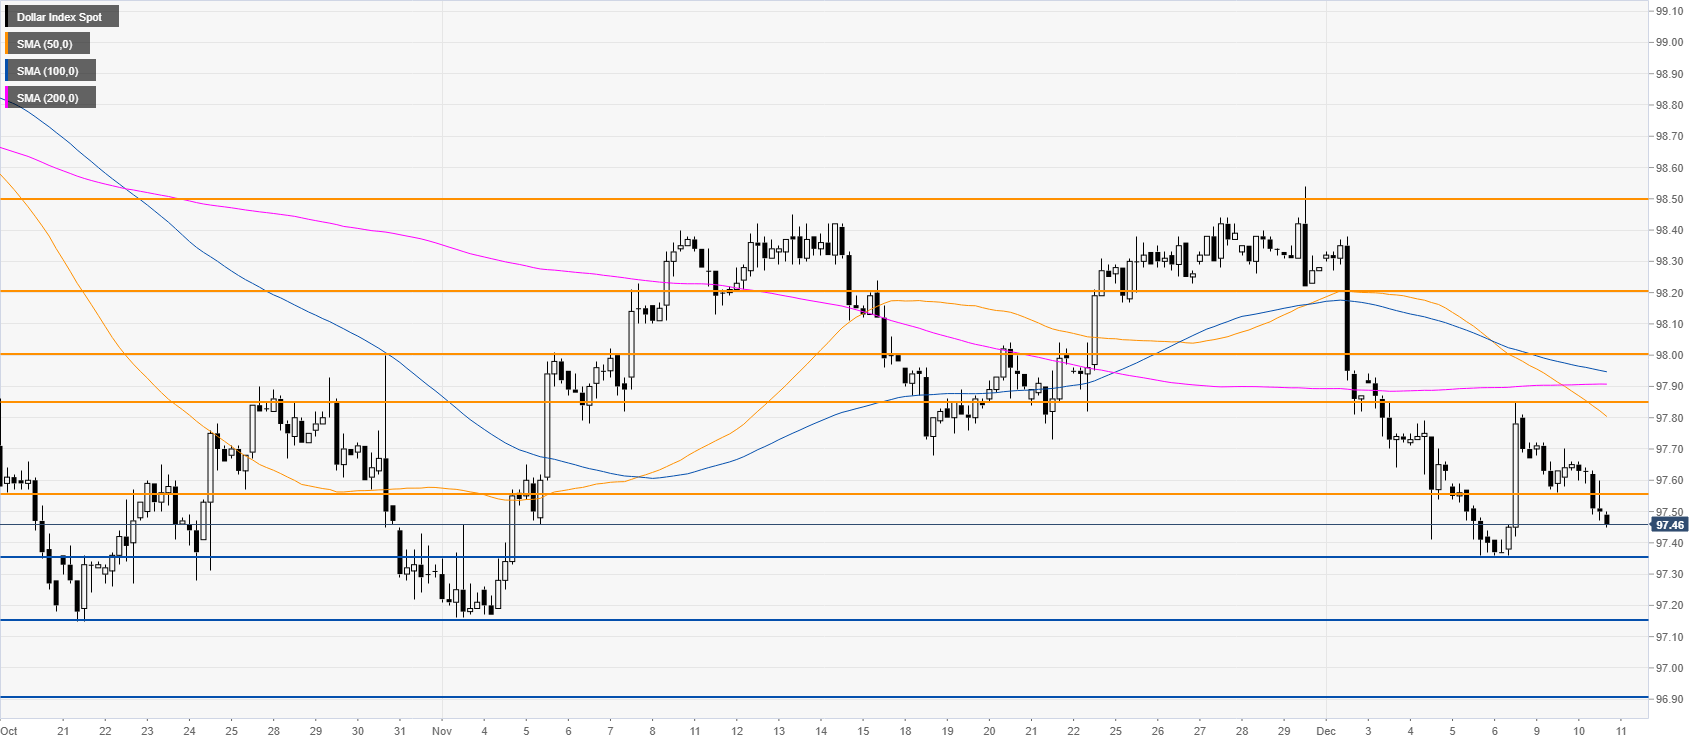
DXY four-hour chart
DXY is under bearish pressure below the 97.55 level and the main SMAs. Bears are eyeing the 98.35 swing low. If the market surpasses this support the market could continue to decline towards the 97.15 and 96.90 price levels.
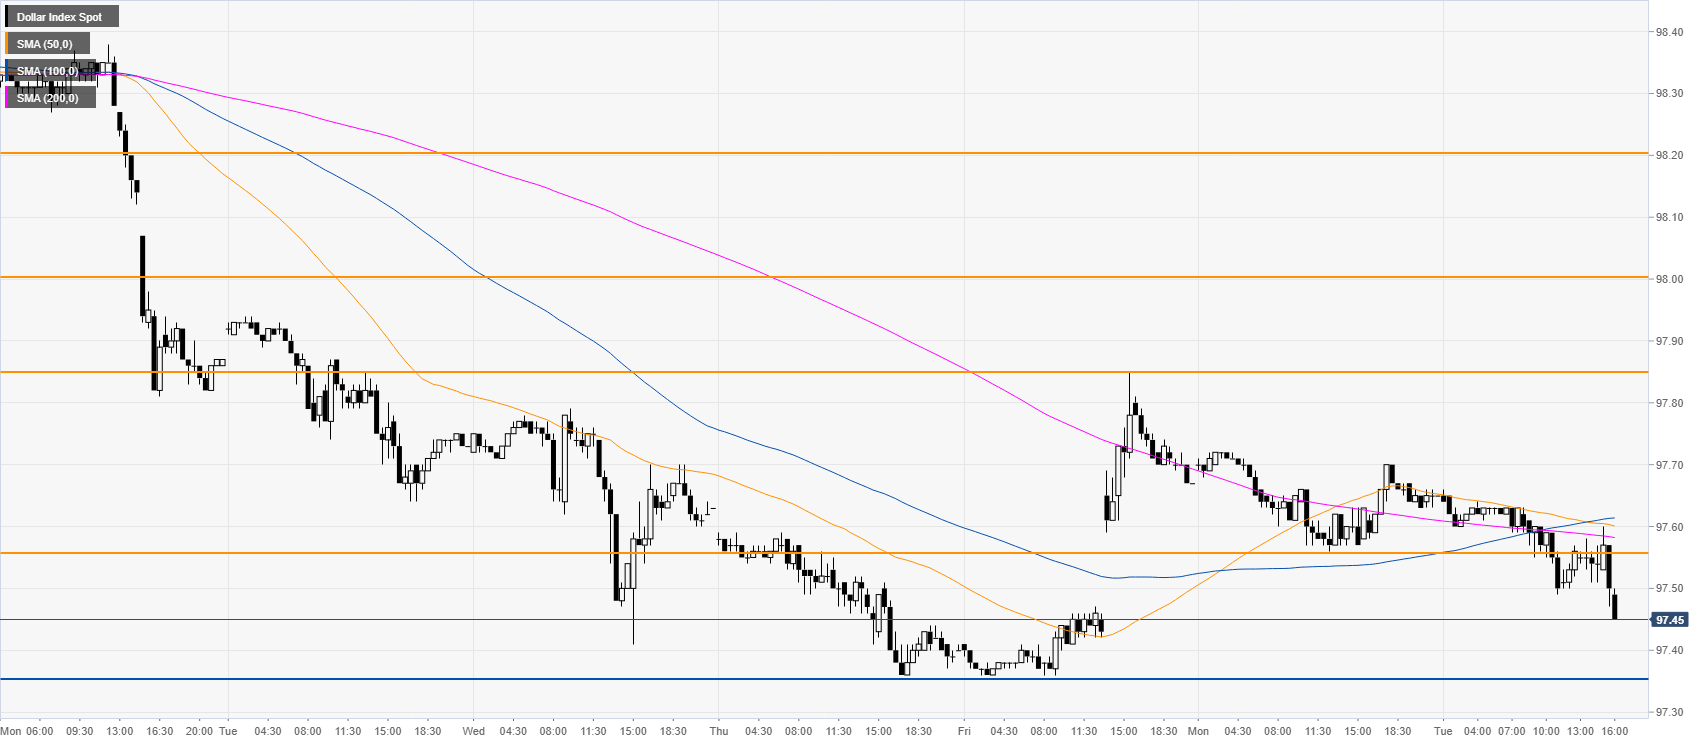
DXY 30-minute chart
DXY is on the back foot below the main SMAs as the bears remain in control. Resistances are seen at the 97.55 and 97.85 levels.
Additional key levels
