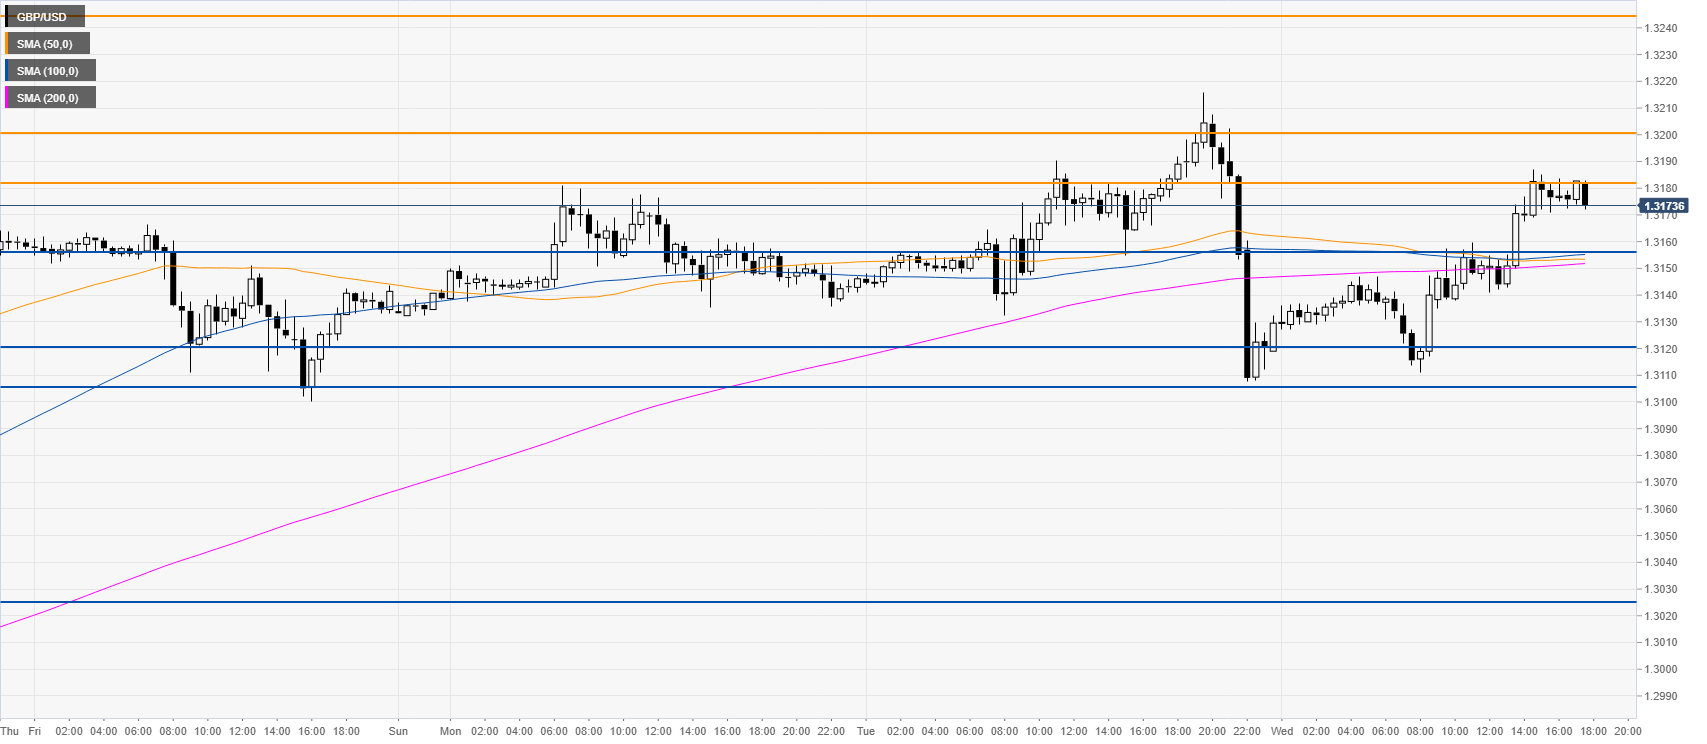
- GBP/USD is trading near session’s highs ahead do the Fed’s rate decision at 19:00 GMT.
- The level to beat for buyers is the 1.3183 resistance.
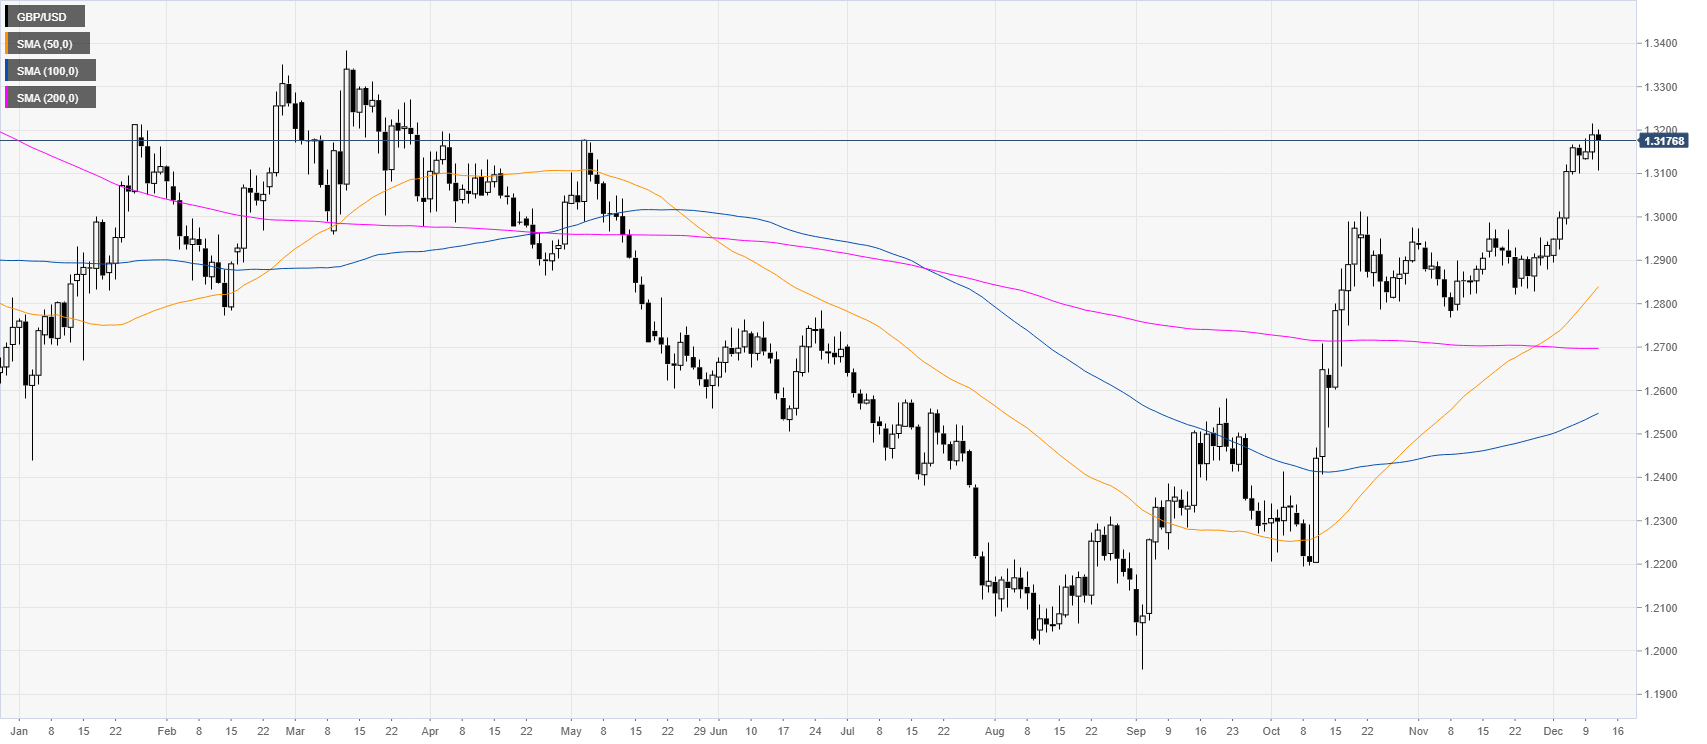
GBP/USD daily chart
The spot is pressuring seven-month highs, testing levels last seen in early May 2019. The Fed’s rate decision at 19:00 GMT and the press conference at 19:30 GMT can lead to high volatility in the markets.
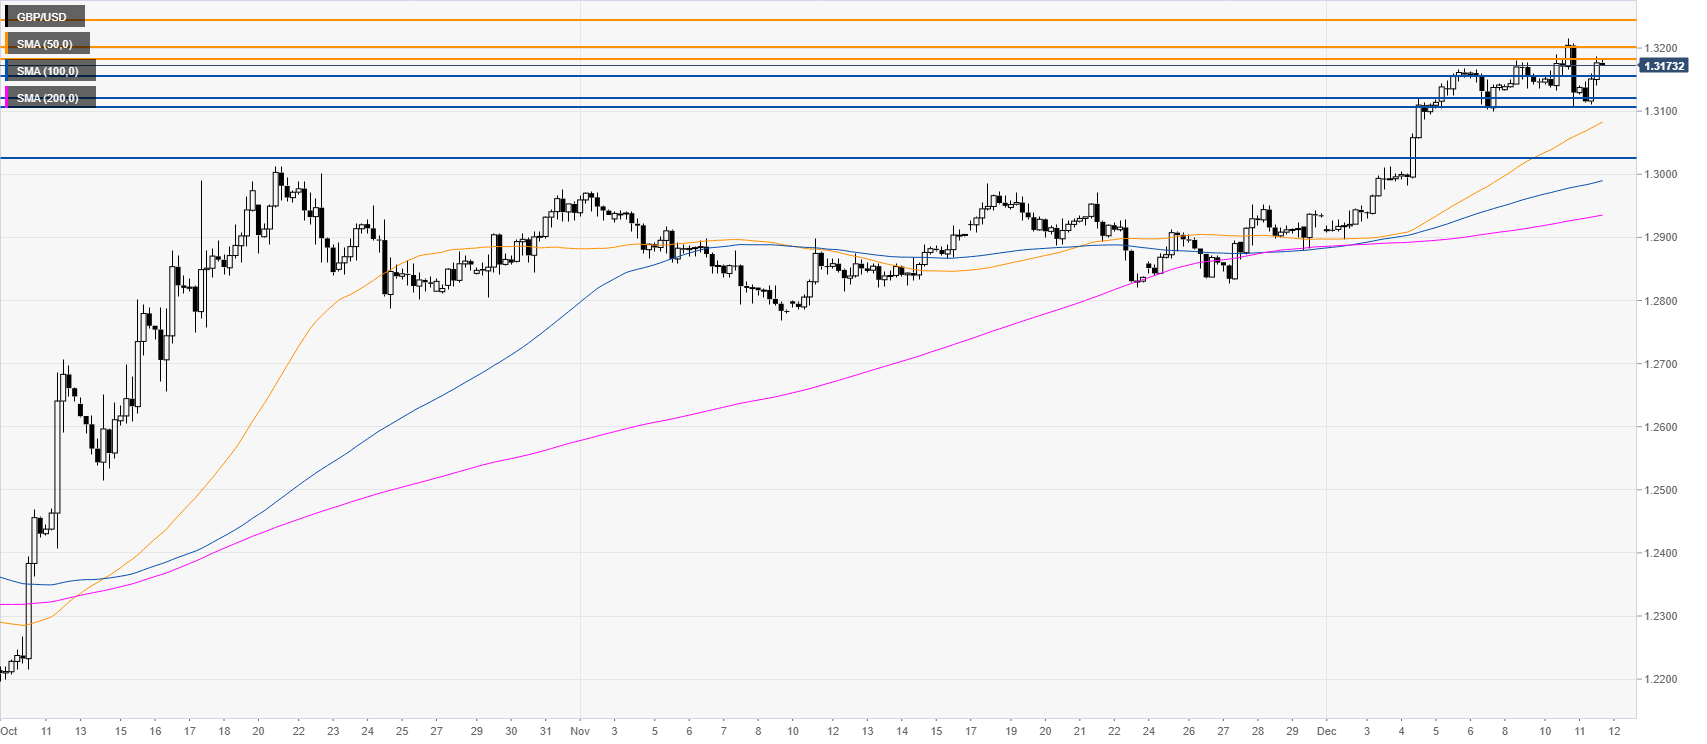
GBP/USD four-hour chart
GBP/USD is evolving above the main SMAs, suggesting bullish momentum. For the fifth consecutive session, bulls are attempting to break above the 1.3183 resistance, which could open the gates to further gains towards the 1.3203 and 1.3244 resistances, according to the Technical Confluences Indicator.
GBP/USD 30-minute chart
The spot is trading above the main SMAs, suggesting a bullish bias in the short term. Support is seen at the 1.3155 level near the main SMAs. However, a daily close below the 1.3121/07 support zone might lead to a deeper pull back down towards the 1.3025 level.
Additional key levels
