- AUD/USD trades above five-month-old falling trend line, 50% Fibonacci retracement.
- Price-positive RSI indicates further upside to 200-DMA and 61.8% Fibonacci retracement.
- The immediate rising support line can restrict the pair’s pullback moves.
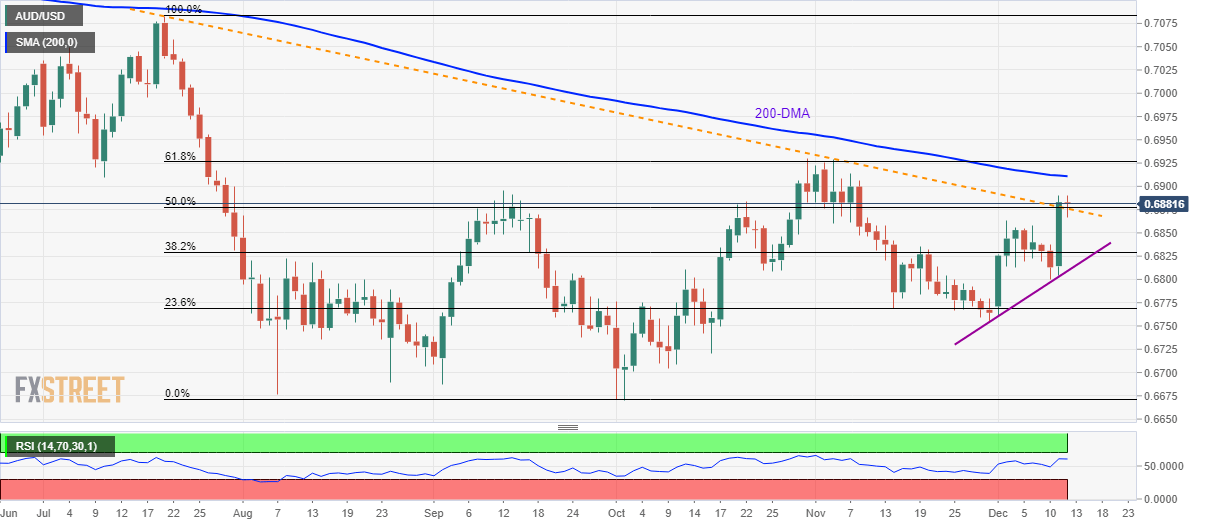
AUD/USD takes the bids to 0.6880 during the pre-European session on Thursday. In doing so, the pair maintains the break of descending trend line since July 19 and 50% Fibonacci retracement of July-October moves.
Other than the successful break of resistance confluence, now support, normal conditions of 14-day Relative Strength Index (RSI) also favor the continuation of pair’s rise.
As a result, buyers can look towards 200-Day Simple Moving Average (DMA) and 61.8% Fibonacci retracement, around 0.6910 and 0.6930 respectively, during additional north-run.
Meanwhile, pair’s daily closing beyond 0.6877/75 confluence can trigger fresh pullbacks to 38.2% Fibonacci retracement level around 0.6830.
However, an upward sloping trend line since November 29, at 0.6810, will confine the quote’s additional downside below 0.6830.
AUD/USD daily chart
Trend: Bullish
