- USD/JPY is at a cross-road trading above the 109.50 level, which was crucial in 2019.
- The level to beat for bulls is the 109.74 resistance.
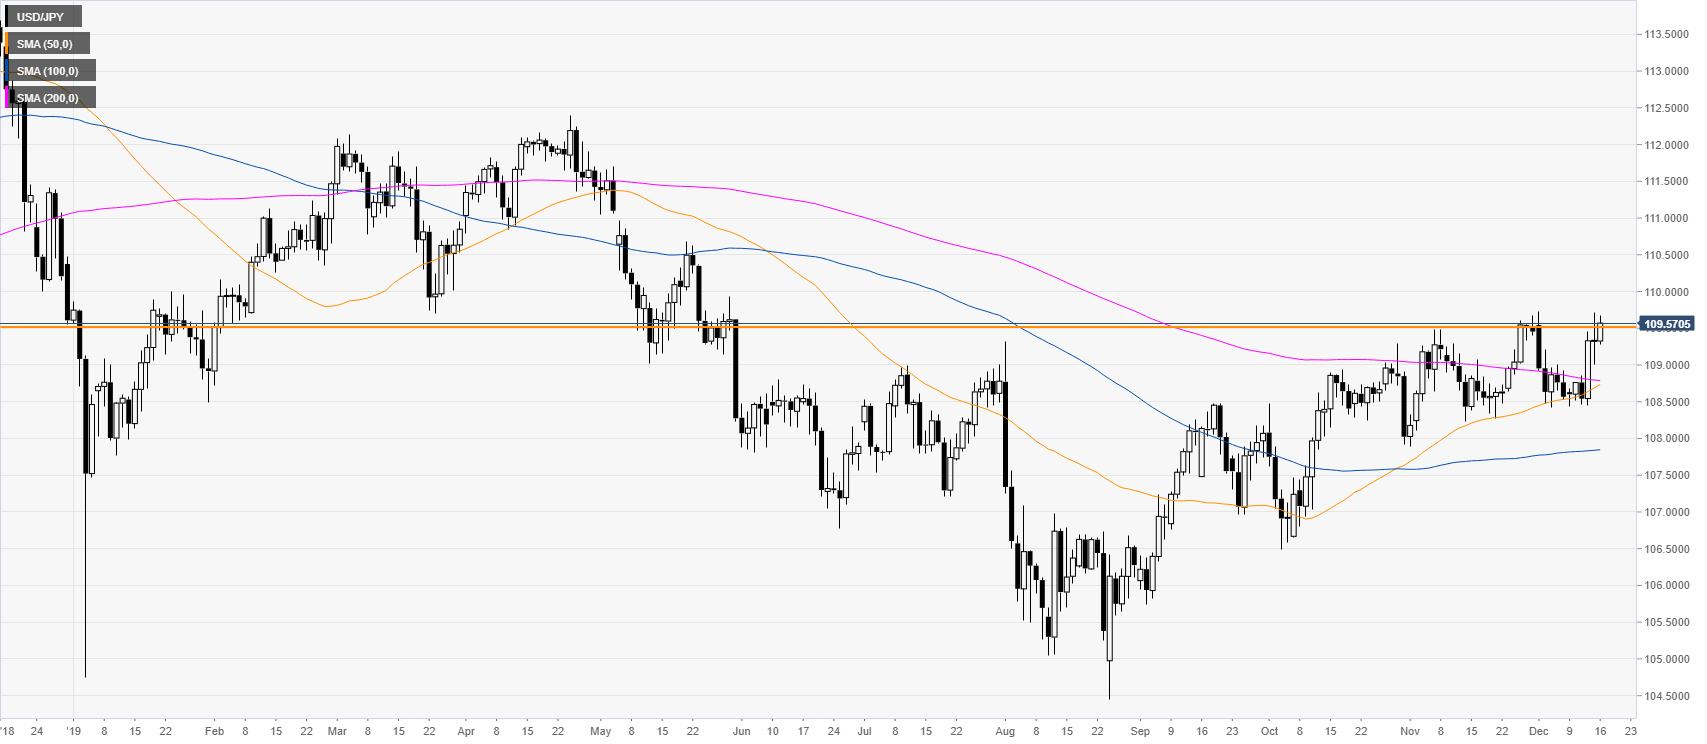
USD/JPY daily chart
USD/JPY is trading near the November/December highs just above the 109.50 level, which acted as a strong support and resistance level throughout the year 2019.
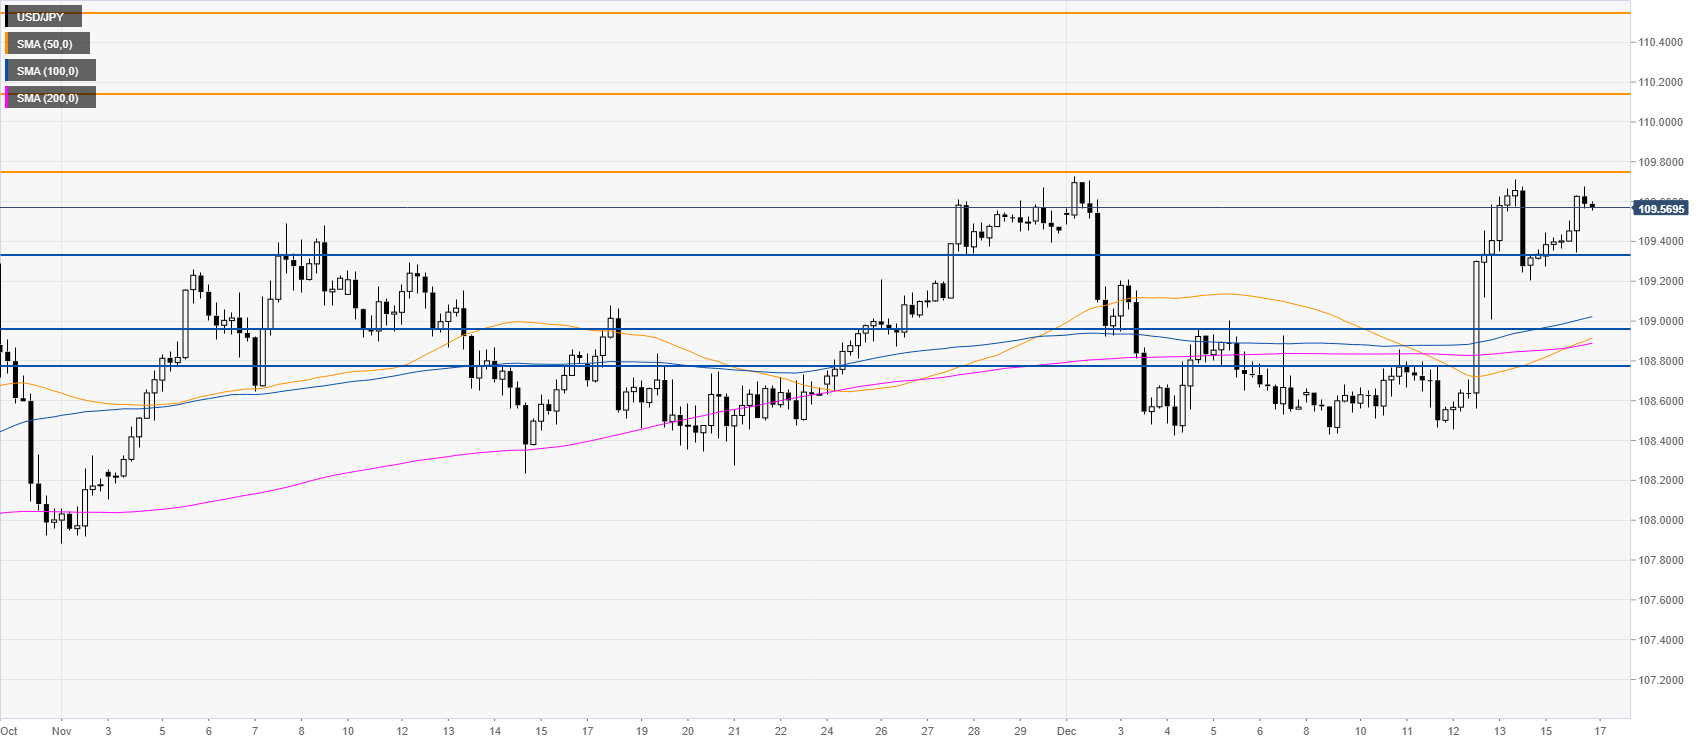
USD/JPY four-hour chart
Ths spot is hovering below the 109.74 resistance. Thu buyers would need a clear breakout above the level in order to open the doors for another potential leg up towards the 110.13 and 110.54 levels. However, it remains to be seen if the bulls will commit because the 109.74 level is likely a strong resistance. On the flip side, if the bears bring the price down below the 109.29 level, the market could weaken towards the 108.95 and 108.78 price levels, according to the Technical Confluences Indicator.
Additional key levels
