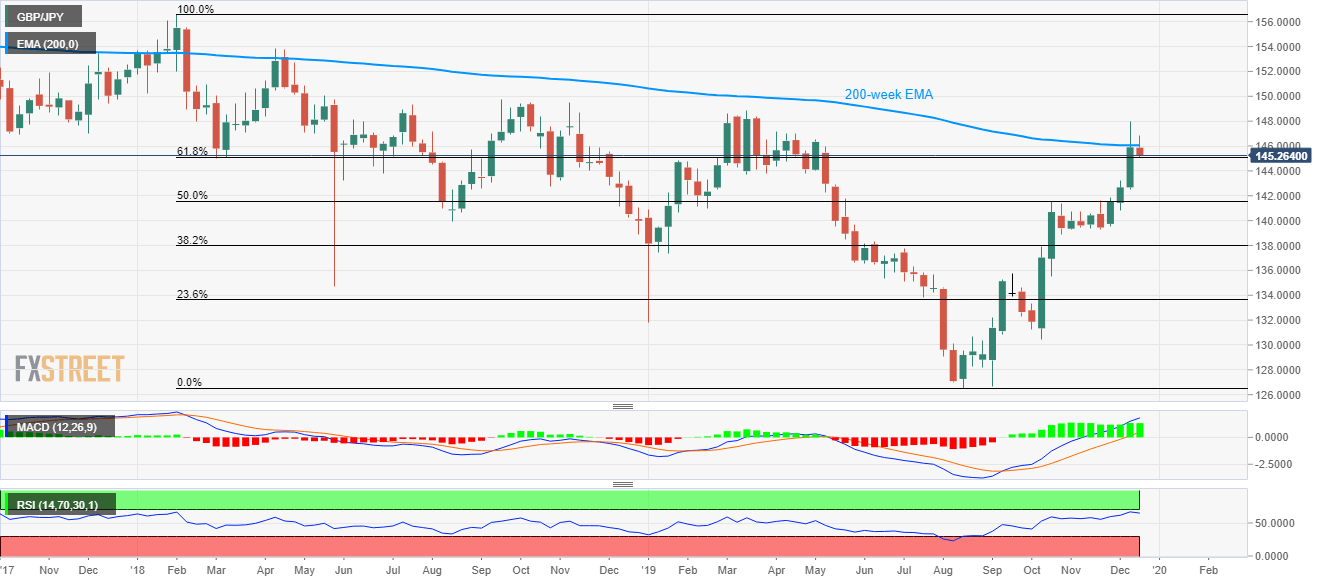
- GBP/JPY nosedives after failing to provide a clear break of 200-week EMA during the previous week.
- Sellers await the break of 61.8% Fibonacci retracement of 2018 top to 2019 bottom.
- Bullish MACD confronts nearly overbought RSI.
GBP/JPY plummets to 145.20, after making the intra-day low of 145.09, during the early Asian session on Tuesday.
The pair surged to a nine-month high after the United Kingdom’s (UK) ruling Conservatives won the general elections. Even so, the quote failed to register a weekly closing beyond 200-week Exponential Moving Average (EMA), now at 146.06.
Read: GBP/USD drops to sub-1.3300 area amid Brexit concerns
While nearly overbought conditions of 14-bar Relative Strength Index (RSI) favors further pullback of the pair, bullish signals from 12-bar Moving Average Convergence and Divergence (MACD) indicates further strength of prices.
As a result, sellers are looking for entry below 61.8% Fibonacci retracement of the year 2018 year to 2019 trough, around 145.00, ahead of targeting March month low near 143.70.
On the contrary, a weekly closing beyond 146.06 level comprising a 200-week EMA could propel the pair’s run-up towards the yearly top nearing 148.90.
GBP/JPY weekly chart
Trend: Pullback expected
