- USD/JPY forms a triangle pattern near the familiar territory.
- 200-HMA, 61.8% of Fibonacci retracement can follow the downside break of the triangle.
- 110.00 mark holds the key to May month top.
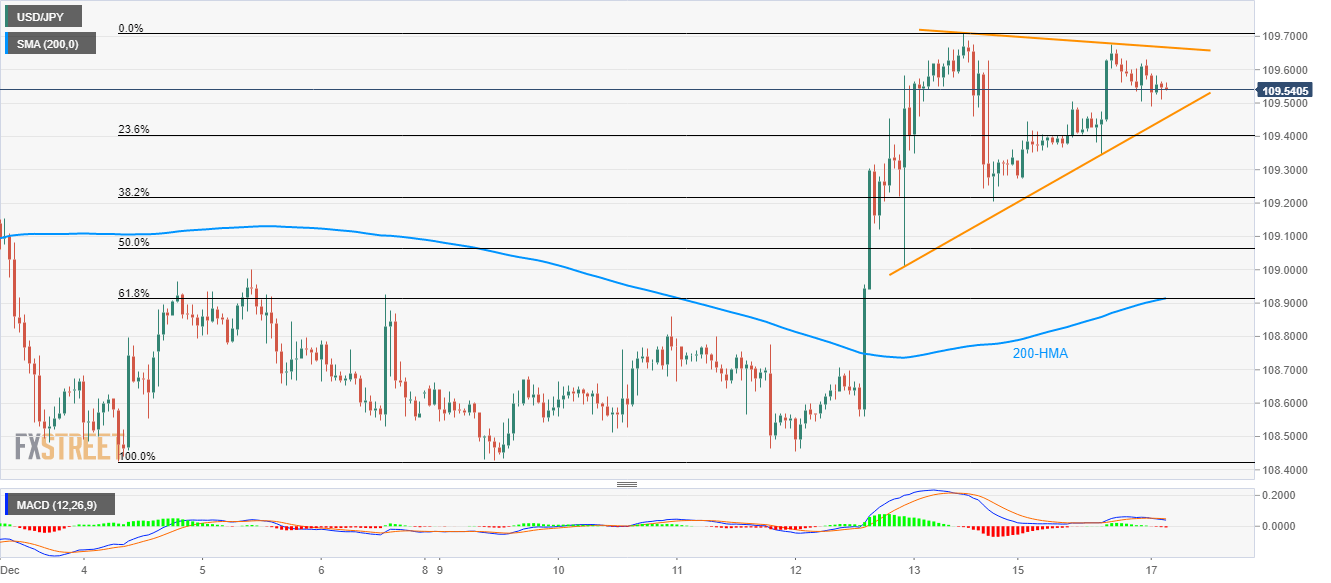
USD/JPY stays within a short-term symmetrical triangle formation while trading around 109.5 during early Tuesday.
The quote’s repeated failures to cross 109.70/75 area and bearish signals from 12-bar Moving Average Convergence and Divergence (MACD) increases the odds of the pair’s fresh declines.
Though, sellers will wait until the pair slips below the support line of the triangle, at 109.45 now. In doing so, 109.10 can be next on their radars.
However, 200-Hour Simple Moving Average (HMA) and 61.8% Fibonacci retracement of pair’s upside from December 04 to 13 could keep the declines guarded around 108.90.
Alternatively, buyers will look for a sustained break of 110.00 to take benefit of the pair’s rise beyond 109.70/75 area including multiple highs marked since the month’s start. As a result, the May month top surrounding 110.70 will be on their watch-list.
USD/JPY hourly chart
Trend: Pullback expected
