- DXY stays below 10-DMA, 50% Fibonacci retracement despite recovering from late-July lows.
- 61.8% Fibonacci retracement adds to the support.
- Bearish MACD keeps sellers hopeful.
The US Dollar Index (DXY) stalls the two-day-old declines while flashing 97.07 on the chart during the pre-European session on Tuesday.
Even so, the greenback gauge stays below 97.35/40 confluence including 10-Day Simple Moving Average (DMA) and 50% Fibonacci retracement of January-October upside.
Also, the 12-bar Moving Average Convergence and Divergence (MACD) registers bearish signals and pleases the sellers.
With this, 61.8% Fibonacci retracement level of 96.87 can offer immediate support to the DXY prior to highlighting the multi-month-old rising trend line, at 96.65 now.
Meanwhile, the gauge’s ability to cross 97.40 on a daily closing basis enables it to confront 38.2% Fibonacci retracement level of 97.93 and a descending resistance line stretched since October-start, at 98.23.
DXY daily chart
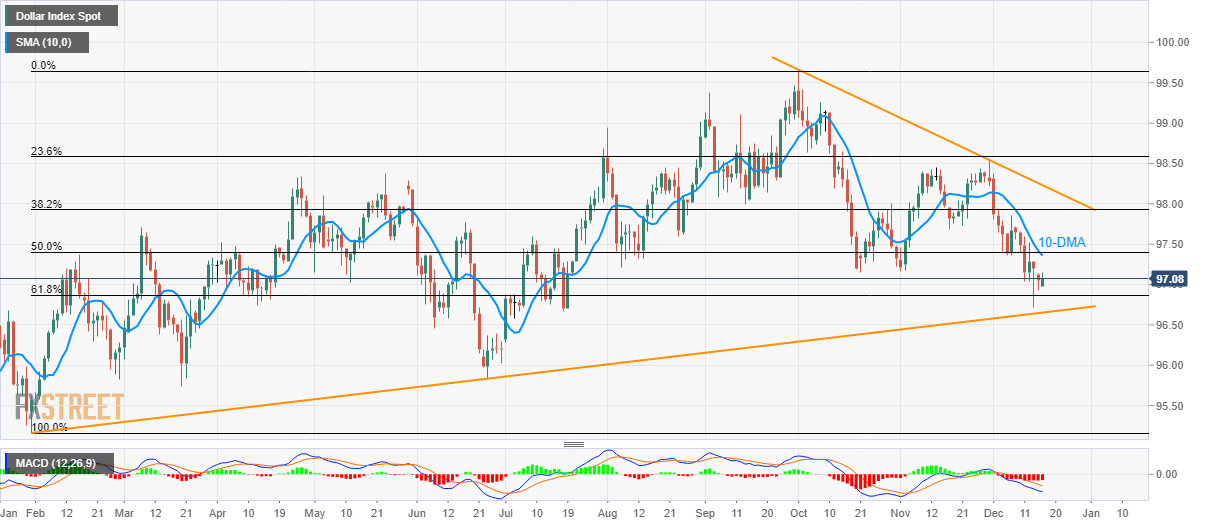
Trend: Bearish
